


Quick Start Guide
Page 6 of 14
•
Under the
Setup
tab, the General, Ver & Comm,
Firmware & Template, and Service pages can be found.
Main
General Data
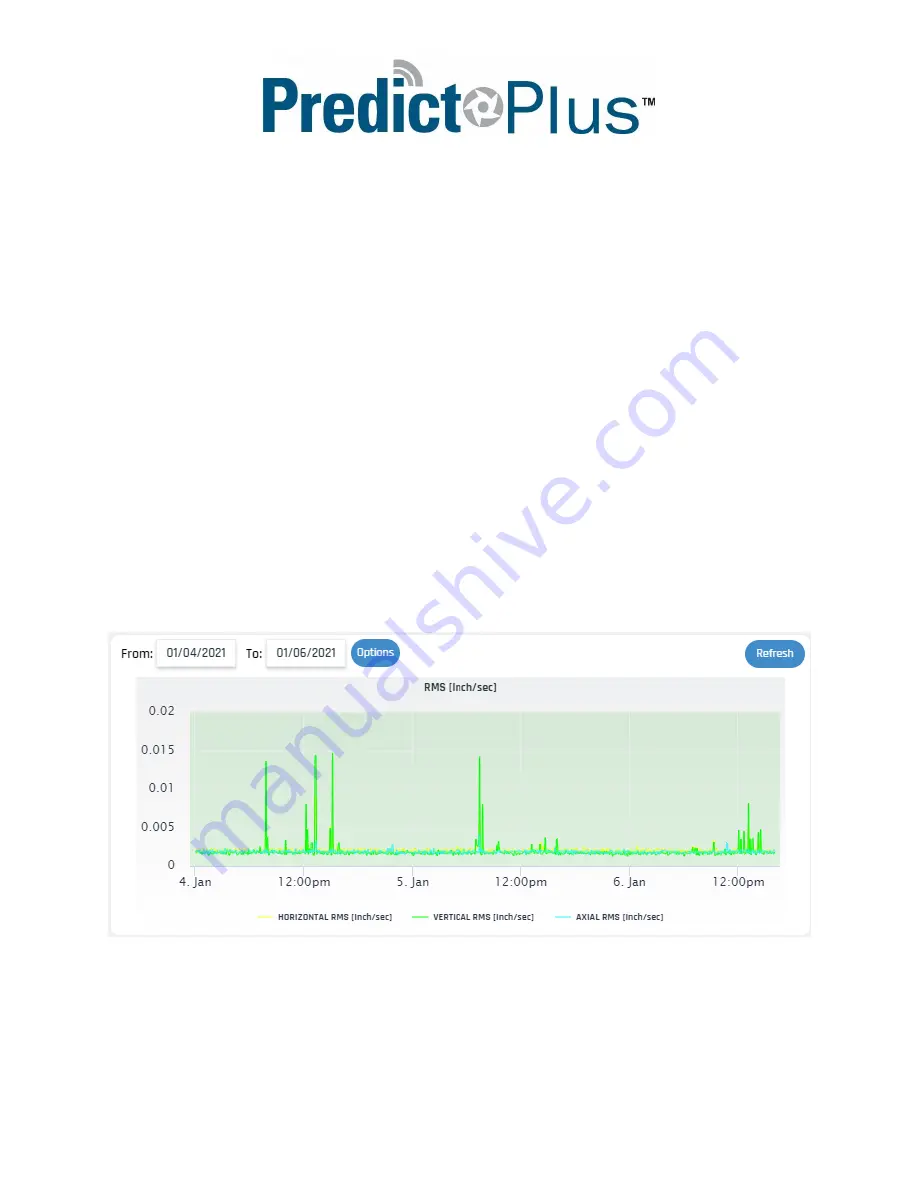
The General Data page features the Overall RMS Vibration, Temperature, and RPM trend graphs. All
trend graphs within the Predict-Cloud can be interacted with in the ways detailed below:
By default, the device will display data from the past week of operation, but this date range can be
expanded using the From: and To: date boxes. Data can also be inspected closer by clicking and dragging
to highlight a specific data range. When a datapoint is hovered over with the cursor, the exact values of
that sample will be shown in a small window along with the exact timestamp. By clicking the Options
button, additional graph interaction tools can be accessed. By inputting Y Axis values into the Lower and
Upper boxes, a boundary condition can be created for easy visual indication of good operation conditions.
To have this boundary displayed in the trend graph, check the Show Boundaries box and click the Save
button (Note: the RMS trend graph is the only trend graph with a boundary condition feature). By
clicking the 3 vertical lined icon in the upper right of the trend box, a drop-down menu will be displayed
with options to view the graph in full screen, print the current graph selection, and export the current
selection in a variety of formats.


