


-22
-12
-30
-22
-12
-30
-18
OFF
ON
PROCESS
-15
AMCL-2
Controller & Limiter
Automatic Multiband
-15
.15
-4
.25
dB
INPUT
0
-2
.2
-8
-10
-6
.4
4
6.5
sec
RELEASE
7
2.5
1
1.3
1.5
-3
LIMITING (dB)
-9
-12
-6
0
POWER
User’s Manual
AMCL2
SOUND REINFORCEMENT
ACOUSTIC RESEARCH
CONTROLLED RADIATION
8
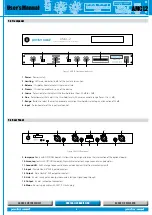
• Process Switch
The AMCL2 features a PROCESS switch (4 on Fig. 2) which allows it to be
excluded from the reproduction chain. When in OFF position, input and
output connectors can be wired directly through high quality audio relay.
The switch is normally used to compare the unprocessed signal with the
signal resulting from using the limiter.
Figure 8. Process switch
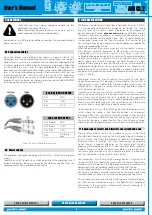
• Automatic LMAX and LEQ Control
(with OPTIONAL DPC215 board)
Automatic control of action parameters is activated by setting the jumper
connector (point 9 in Fig. 3) to NORMAL. The input line signal will now drive
limiter action.
The default values of
Lmax
and
Leq
parameters, factory pre-set to 104.5 dB
and 95 dB respectively, can be changed using the dipswitch control panel (10
in Fig. 3) situated on the rear panel next to the JUMPER CAL connector. Use
dipswitches 1-6 to change the Lmax value (Fig. 9): setting the selector to ON
will increase Lmax value as shown in the table below.
The Leq value can be changed using dipswitches 7-10: each dipswitch set to
ON decreases LEQ value as shown in the table below.
Manuale d’uso
via Monti Urali, 33 - 42100 Reggio Emilia (Italia) • tel. +39 0522 557735 • fax +39 0522 391288 • e-mail: [email protected]
www.peeckersound.com
via Monti Urali, 33 - 42100 Reggio Emilia (Italia) • tel. +39 0522 557735 • fax +39 0522 391288 • e-mail: [email protected]
www.peeckersound.com
www.peeckersound.com
®
Operating controls
6
Figure 2: Hard Knee Compression Curve,and OverEasy® Compression Curve, and Threshold
LEDs.
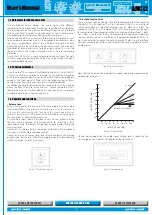
Figure 3 shows the effect of 2:1 compression on a signal as it rises above and falls below the threshold.
Below the threshold the signal is not affected. Above the threshold, the output signal increases by only
half of the increase (in dB) of the input signal level. In other words, with a 2 dB increase in input level,
the output increases by only 1 dB, hence the 2:1 compression ratio.
Figure 3: Compression Effect on Signal Level with a 2:1 Ratio at a -20 dBu Threshold
Contour Switch
- This switch adds a gentle low frequency de-emphasis into the detector path. This is
extremely useful in keeping low frequency program material from “muffling” or “punching holes in” the
compressed signal. This feature allows faster attack times and higher compression ratios with less arti-
facts. The switch will light indicating contouring is activated.
Compressor Ratio Control
- This control selects the ratio between input and the output levels for sig-
nals above the level set by the COMPRESSION THRESHOLD control. It is adjustable between 1:1 and
infinity:1. Note, when OverEasy® processing is selected, the ratio transitions smoothly from the linear to
the compressed region. As the signal exceeds the threshold, the ratio approaches the ratio set by the
COMPRESSOR RATIO control.
Gain Reduction Meter
- This 12 stage meter shows the amount of gain reduction due to compression,
expansion/gating, or Intelligent Predictive Limiting™, displaying gain reduction from 0 to 30 dB.
Attack Control
- The ATTACK control sets the amount of time it takes the 1066 to begin compressing a
signal once the detector has sensed a signal above threshold. The ATTACK range is from 3 dB/msec (for
a tighter and more noticeable compression effect with very little overshoot) to .04 dB/msec (for more
delayed, gradual compression). A very fast ATTACK setting will cause the 1066 to act like a peak limiter
-40
-30
-20
-10
0
10
Time
Signal Level (dBu)
Below Threshold
Above Threshold
Input Signal
Output Signal
-40
-30
-20
-10
0
10
Time
Signal Level (dBu)
Below Threshold
Above Threshold
Input Signal
1:1
2:1
4:1
:1
<
15
<
10
<
5
0
+5
+15
+20
+10
INPUT LEVEL (dB)
OUTPUT LEVEL (dB)
<
15
<
10
<
5
0 +5
+15 +20
+10
RED
Below Threshold
Above Threshold
OverEasy Range
GR
EE
N
AM
BER
-15
-10
-5
0
+5
+15
+20
+10
INPUT LEVEL (dB)
OUTPUT LEVEL (dB)
-15 -10 -5
0
+5
+15 +20
+10
1:1 Unity
2:1
4:1
:1
20:1
RED
Above Threshold
GREEN
Below Threshold
Rotation Point Threshold
Durante il funzionamento del dispositivo, il livello di limitazione
del segnale audio Vu Meter (2 di Fig. 2) è visualizzato tramite
un’opportuno display a led posto sempre nel pannello frontale.
Grafico 1: Effetto Threshold
Figura 7: Display Vu Meter
Tasto Process
•
L’
AMCL2
è provvisto di pulsante PROCESS (4 di Fig.2) per
l’esclusione dell’apparecchio dalla catena di riproduzione. Il
pulsante in posizione 0FF, abilita un collegamento diretto fra i
connettori di ingresso e quelli d’uscita tramite release di alta qualità
audio. Normalmente l’interruttore è utilizzato per comparare il
segnale non elaborato rispetto al segnale risultante dopo l’impiego
del limitatore.
Figura 8: Tasto Process
Controllo automatico L
•
max
e L
eq
(con scheda DPC215 OPZIONALE)
Il controllo automatico dei parametri di intervento avviene inserendo
jumper di Fig. 10 nella posizione NORMAL. In questo modo, il
segnale di linea posto in ingresso pilota l’intervento del dispositivo.
I valori di default dei parametri L
max
e L
EQ
, impostati da fabbrica a
104.5 dB e 95 dB rispettivamente, possono essere variati tramite
il banco di
dipswitch
(10 di Fig.2), posto sul pannello posteriore
vicino al connettore JUMPER CAL. Il valore di L
max
(Fig. 9) è
modificabile agendo sui diversi
dipswitch
dall’1 al 6: impostando il
selettore in posizione ON si incrementa il valore di L
max
secondo la
tabella riportata. Invece, il valore di L
EQ
è modificabile agendo sui
dipswitch
dal 7 al 10: ogni
dipswitch
impostato su ON decrementa
il valore di L
EQ
come da tabella riportata sotto.
���������
���������������
�����������
��
��
��
��
��
��
��
��
��
������
����
����
����
����
�����
����
������
����
�������������������
������������
�
�
�
�
�
�
�
�
�
��
���
����
��
���
�
����
�
��
�
�
�
� �
�
�
��
Figura 9: Banco di dipswitch
�
�
�
����
�
�
�
�����
������
���������
����������
���
����
�����������������
���������
�������
���������
����������
�
�
�
�
�
�
�
�
� ��
����
���
�
�
�
�
�
�
����
������
���������������������
����������
�����������
�������������
�
�
�
����
����������
������������
�������������
���������
��������������������
�������
Figura 10: Scheda DPC215 (OPZIONALE)
Dopo aver connesso l’
AMCL2
alla linea di alimentazione e ai
dispositivi di ingresso e uscita, settare i controlli come segue:
Posizionare il pulsante PROCESS su ON.
1.
Posizionare il pulsante RANGE in 0 dB.
2.
Posizionare il commutatore COARSE al valore massimo (+2
3.
dBm).
Posizionare il tempo di rilascio su un valore opportuno tale da
4.
ottenere la funzionalità desiderata (vedi paragrafo “Tempo di
rilascio”).
Tenendo il JUMPER CAL disinserito, fare suonare l’impianto
5.
con un brano a bassa densità, in modo da produrre il più
basso valore di L
EQ
.
Ritoccare poi il valore di soglia THRESHOLD per ottenere il
6.
livello L
EQ
desiderato. Agire sull’attenuatore di ingresso fino
ad ottenere sul display un’attenuazione che varia da 3dB a
6dB circa.
Impostare i livelli desiderati di L
7.
max
e L
EQ
agendo sul banco
di dipswitch, nel caso in cui si vogliano valori diversi da quelli
impostati dalla fabbrica (L
max
= 104,5 dB ; L
EQ
= 95 dB).
8. Setup
9
Manuale d’uso
via Monti Urali, 33 - 42100 Reggio Emilia (Italia) • tel. +39 0522 557735 • fax +39 0522 391288 • e-mail: [email protected]
www.peeckersound.com
via Monti Urali, 33 - 42100 Reggio Emilia (Italia) • tel. +39 0522 557735 • fax +39 0522 391288 • e-mail: [email protected]
www.peeckersound.com
www.peeckersound.com
®
Operating controls
6
Figure 2: Hard Knee Compression Curve,and OverEasy® Compression Curve, and Threshold
LEDs.
Figure 3 shows the effect of 2:1 compression on a signal as it rises above and falls below the threshold.
Below the threshold the signal is not affected. Above the threshold, the output signal increases by only
half of the increase (in dB) of the input signal level. In other words, with a 2 dB increase in input level,
the output increases by only 1 dB, hence the 2:1 compression ratio.
Figure 3: Compression Effect on Signal Level with a 2:1 Ratio at a -20 dBu Threshold
Contour Switch
- This switch adds a gentle low frequency de-emphasis into the detector path. This is
extremely useful in keeping low frequency program material from “muffling” or “punching holes in” the
compressed signal. This feature allows faster attack times and higher compression ratios with less arti-
facts. The switch will light indicating contouring is activated.
Compressor Ratio Control
- This control selects the ratio between input and the output levels for sig-
nals above the level set by the COMPRESSION THRESHOLD control. It is adjustable between 1:1 and
infinity:1. Note, when OverEasy® processing is selected, the ratio transitions smoothly from the linear to
the compressed region. As the signal exceeds the threshold, the ratio approaches the ratio set by the
COMPRESSOR RATIO control.
Gain Reduction Meter
- This 12 stage meter shows the amount of gain reduction due to compression,
expansion/gating, or Intelligent Predictive Limiting™, displaying gain reduction from 0 to 30 dB.
Attack Control
- The ATTACK control sets the amount of time it takes the 1066 to begin compressing a
signal once the detector has sensed a signal above threshold. The ATTACK range is from 3 dB/msec (for
a tighter and more noticeable compression effect with very little overshoot) to .04 dB/msec (for more
delayed, gradual compression). A very fast ATTACK setting will cause the 1066 to act like a peak limiter
-40
-30
-20
-10
0
10
Time
Signal Level (dBu)
Below Threshold
Above Threshold
Input Signal
Output Signal
-40
-30
-20
-10
0
10
Time
Signal Level (dBu)
Below Threshold
Above Threshold
Input Signal
1:1
2:1
4:1
:1
<
15
<
10
<
5
0
+5
+15
+20
+10
INPUT LEVEL (dB)
OUTPUT LEVEL (dB)
<
15
<
10
<
5
0 +5
+15 +20
+10
RED
Below Threshold
Above Threshold
OverEasy Range
GR
EE
N
AM
BER
-15
-10
-5
0
+5
+15
+20
+10
INPUT LEVEL (dB)
OUTPUT LEVEL (dB)
-15 -10 -5
0
+5
+15 +20
+10
1:1 Unity
2:1
4:1
:1
20:1
RED
Above Threshold
GREEN
Below Threshold
Rotation Point Threshold
Durante il funzionamento del dispositivo, il livello di limitazione
del segnale audio Vu Meter (2 di Fig. 2) è visualizzato tramite
un’opportuno display a led posto sempre nel pannello frontale.
Grafico 1: Effetto Threshold
Figura 7: Display Vu Meter
Tasto Process
•
L’
AMCL2
è provvisto di pulsante PROCESS (4 di Fig.2) per
l’esclusione dell’apparecchio dalla catena di riproduzione. Il
pulsante in posizione 0FF, abilita un collegamento diretto fra i
connettori di ingresso e quelli d’uscita tramite release di alta qualità
audio. Normalmente l’interruttore è utilizzato per comparare il
segnale non elaborato rispetto al segnale risultante dopo l’impiego
del limitatore.
Figura 8: Tasto Process
Controllo automatico L
•
max
e L
eq
(con scheda DPC215 OPZIONALE)
Il controllo automatico dei parametri di intervento avviene inserendo
jumper di Fig. 10 nella posizione NORMAL. In questo modo, il
segnale di linea posto in ingresso pilota l’intervento del dispositivo.
I valori di default dei parametri L
max
e L
EQ
, impostati da fabbrica a
104.5 dB e 95 dB rispettivamente, possono essere variati tramite
il banco di
dipswitch
(10 di Fig.2), posto sul pannello posteriore
vicino al connettore JUMPER CAL. Il valore di L
max
(Fig. 9) è
modificabile agendo sui diversi
dipswitch
dall’1 al 6: impostando il
selettore in posizione ON si incrementa il valore di L
max
secondo la
tabella riportata. Invece, il valore di L
EQ
è modificabile agendo sui
dipswitch
dal 7 al 10: ogni
dipswitch
impostato su ON decrementa
il valore di L
EQ
come da tabella riportata sotto.
���������
���������������
�����������
��
��
��
��
��
��
��
��
��
������
����
����
����
����
�����
����
������
����
�������������������
������������
�
�
�
�
�
�
�
�
�
��
���
����
��
���
�
����
�
��
�
�
�
� �
�
�
��
Figura 9: Banco di dipswitch
�
�
�
����
�
�
�
�����
������
���������
����������
���
����
�����������������
���������
�������
���������
����������
�
�
�
�
�
�
�
�
� ��
����
���
�
�
�
�
�
�
����
������
���������������������
����������
�����������
�������������
�
�
�
����
����������
������������
�������������
���������
��������������������
�������
Figura 10: Scheda DPC215 (OPZIONALE)
Dopo aver connesso l’
AMCL2
alla linea di alimentazione e ai
dispositivi di ingresso e uscita, settare i controlli come segue:
Posizionare il pulsante PROCESS su ON.
1.
Posizionare il pulsante RANGE in 0 dB.
2.
Posizionare il commutatore COARSE al valore massimo (+2
3.
dBm).
Posizionare il tempo di rilascio su un valore opportuno tale da
4.
ottenere la funzionalità desiderata (vedi paragrafo “Tempo di
rilascio”).
Tenendo il JUMPER CAL disinserito, fare suonare l’impianto
5.
con un brano a bassa densità, in modo da produrre il più
basso valore di L
EQ
.
Ritoccare poi il valore di soglia THRESHOLD per ottenere il
6.
livello L
EQ
desiderato. Agire sull’attenuatore di ingresso fino
ad ottenere sul display un’attenuazione che varia da 3dB a
6dB circa.
Impostare i livelli desiderati di L
7.
max
e L
EQ
agendo sul banco
di dipswitch, nel caso in cui si vogliano valori diversi da quelli
impostati dalla fabbrica (L
max
= 104,5 dB ; L
EQ
= 95 dB).
8. Setup
9
Figure 9. Dipswitch control panel
Figure 10. DPC215 board (OPTIONAL)
8. SETUP
Once you have connected the AMCL2 to the power mains and the input
and output connectors, set the controls as follows:
1. Position the PROCESS button to ON.
2. Position the RANGE button to 0dB.
3. Position the COARSE switch to maximum value (+2dBm).
4. Position the release time to a value suitable for the function you require
(see paragraph on “Release time”).
5. With the JUMPER CAL off, play a piece of low density music to produce
the lowest possible LEQ value.
6. Adjust the THRESHOLD value to obtain the required LEQ value. Adjust
the input attenuator until the display shows attenuation varying
roughly from 3dB to 6dB.
7. Should you wish to change the factory pre-set LMAX and LEQ values
(LMAX = 104.5dB; LEQ = 95dB) use the dipswitch panel to set your
required values.
8. Set JUMPER CAL to NORMAL.
9. Play a piece of high density music (to produce the highest possible
LEQ value).
10. Perform a monitoring exercise lasting no less than 30 minutes playing
different types of music genres. Record the resulting LMAX and LEQ
data.
11. If the recorded values exceed allowed levels, use the various
THRESHOLD, LMAX and LEQ controls to get as close as possible to the
required limits.
Note: points 5. 7. and 8. are only applicable if the OPTIONAL DPC215 board is
installed.
8.1 XLR connections
The following diagrams show the possible balanced and unbalanced
connections with Cannon XLR connectors.
Figure 11. XLR connections


