


Troubleshooting
QT
RACE
-
U
SER
M
ANUAL
© 2018 PDQLogic Ltd.
QTrace User Manual Rev 1.01
Page 48
8
Execution counts
missing in start-up
code
QTrace Analyser
did not
synchronise
with processor
start-up
Ensure execution started with the CPU halted at the reset
handler (use a breakpoint if required)
9
Trace decode rate*
drops quickly
PC low power
mode
Ensure Windows power scheme is set for high performance
Trace
configuration
Ensure target firmware is not:
• Overwriting trace I/O settings e.g. for STM32 part, trace =
PE2-PE6
• Configuring Single Wire Output (SWO) debug mode
10
Losing trace
synchronisation after
trace was working OK
ELF file out-of-
sync
Perform a project clean and rebuild
11
Repeatable loss of
sync. in specific code
areas
ELF file issue or
QTrace Analyser
bug
Rebuild ELF file and retry. Send ELF file to PDQLogic for
analysis if issue persists
12
Trace buffer overflow
Insufficient PC
CPU time / USB
hub issue
Verify that:
• No other CPU intensive applications are running
• The QTrace Analyser option 'Set application as high priority'
is selected
• The Windows power scheme is set for high performance
• The PC spec. is sufficient e.g. 8GB+ RAM, i5 / i7 CPU
• Execution started with the CPU halted at the reset handler
(use a breakpoint if required)
Also try:
• Power cycling the USB hub if resumed from sleep or if trace
has been running OK
• Reduce target clock speed
13
Source lines with no
code margin highlights
Compiler
configuration
issue
• Try turning off optimisation and removing static function
declaration
• Deselect 'put code in separate sections' complier switch &
recompile
• Use DWARF-2 or 3, e.g. for GCC use the '-g3' & '-gdwarf-3'
complier switches
14
Tracing unexpectedly
stops when target is
still running
Potential USB
issue
• Unplug the trace probe USB lead then reconnect it
• Unplug the USB lead from the hub which the trace probe is
connected to, power cycle the hub & reconnect its USB lead
• Reboot PC (if the problem persists select menu option
Help
Report a Problem
)
* See 'Trace Stats' tab
** See
C:\Users\Public\PDQLogic\QTraceAnalyser\Debugger Scripts
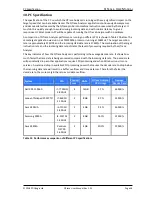
Table 11 Troubleshooting