Trace Capture
QT
RACE
-
U
SER
M
ANUAL
© 2018 PDQLogic Ltd.
QTrace User Manual Rev 1.01
Page 26
4.2.3.2
Function pinning
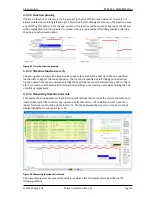
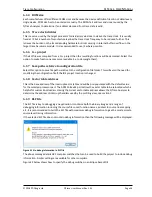
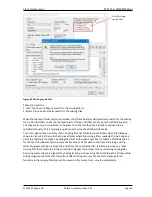
If there is a function of interest, it can be ‘pinned’ to the top of the function name list to ensure it is
always visible when scrolling left and right. This is done by left clicking the mouse on the function name
and selecting
Pin Function
from the pop-up menu. The function will be moved to the top of the list and
will be highlighted in red to indicate it is pinned. It can be unpinned by left clicking and then selecting
the
Unpin Function
menu option.
Figure 25 Timeline function pinning
4.2.3.3
Timeline function search
The pop-up menu in Figure 25 above also has options to search for the next transition to a specified
function left or right of the current position. The function is specified by left clicking on the desired
function name from the list and then selecting the
Search Back
or
Search Forward
menu option. There
are short-cuts to search backwards or forwards by clicking on the function name while holding the Ctrl
or Shift key respectively.
4.2.3.4
Measuring timeline intervals
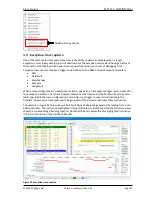
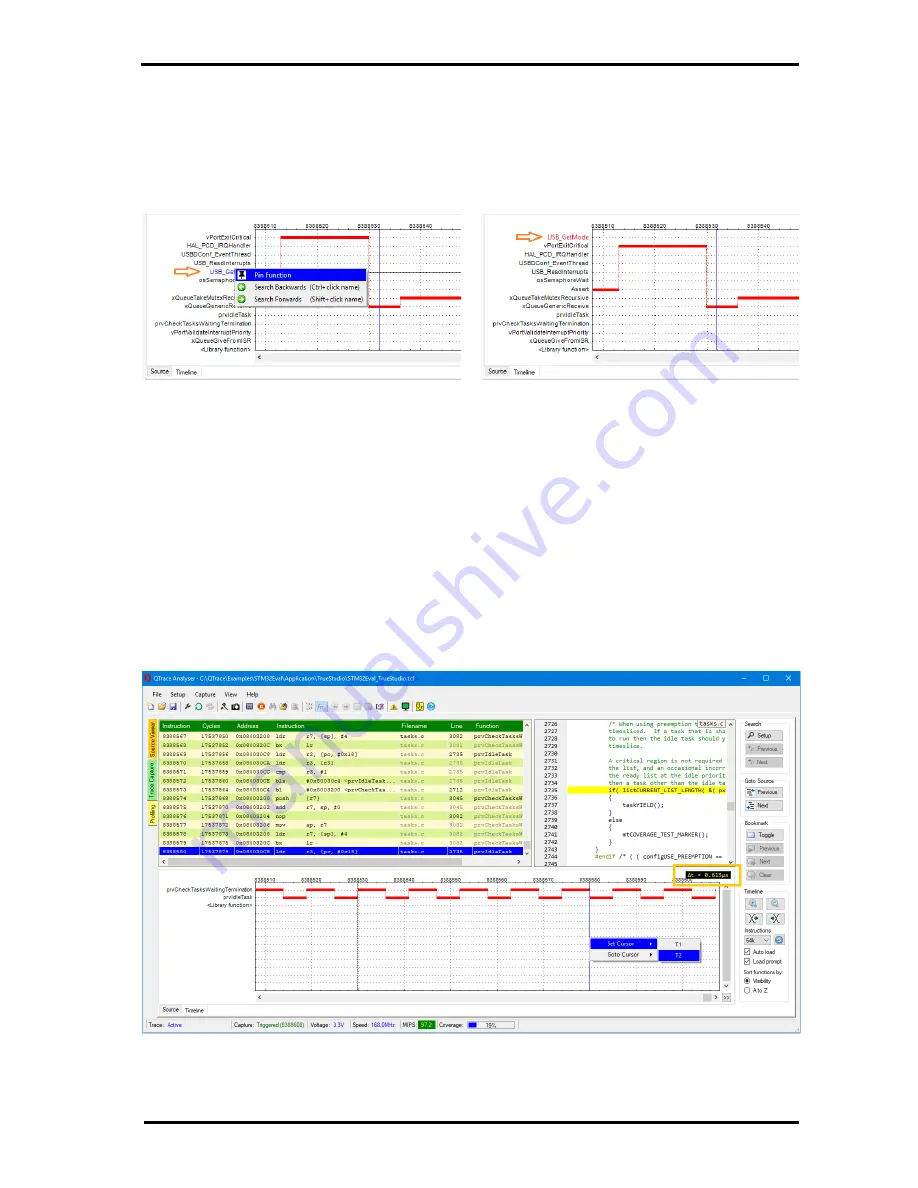
To measure the time between multiple function calls left click the mouse at the start of the function of
interest then right click to show a pop-up menu. Select
Set Cursor
T1
to define cursor T1 and then
repeat for the second function of interest for T2. The time between the two cursors is given in the
Δ
t
display highlighted in orange in Figure 26.
Figure 26 Measuring function call intervals
The trace capture view has several other features which affect all views and are described in the
following sections.


