Rev. 007 Date 2010-01-13
CyFlow
®
space Instrument Operating Manual
4/26
Typical
Steps
of
Particle
Analysis
1. Cells are separated in a suspension and
stained with fluorescent markers.
2. Light from the laser(s) excites cell
–bound
fluorophores and is scattered by the cells.
3. Fluorescence signals are displayed and
analysed
in
histogram-
and/or
dotplot-
diagrams.
1. Preparation and Staining
For flow cytometric analysis, the cells (or other
particles) must be separated from each other in
an aqueous suspension. Typically, if not
generating
sufficient
optical
signals
by
themselves, the cells are then labelled by staining
with one or more fluorescent dyes. The
fluorescent molecules bind to the cell substance
of interest, e.g. CD4- and CD45-antibodies bind
cell surface antigens of leukocytes. The quantity
of labelling cells with a specific dye is proportional
to the number of antigen molecules of a single
cell. A good preparation with suited reagents is
the requirement for a precise analysis. A check of
staining in a fluorescence microscope can un-
reveal preparation problems.
2. Flow Cytometry Analysis
While passing through a flow cuvette one-by-one,
the cells are individually illuminated by the light
spot of the laser. Due to the excitation, the dye
molecules emit fluorescence of characteristic
colour (emission wavelength spectrum). This
fluorescence light is separated into colour ranges
by means of optical filters. The intensity of each
colour range is analysed for each single cell.
Besides fluorescence, the intensity of light
scattered by each cell can be measured. Scatter
light is measured in forward direction from the
light source (forward scatter, FSC) and sideward
direction (side scatter, SSC). The scatter intensity
is a measure of cell size and morphology. Scatter
light can be used to identify a cell before
analysing its fluorescence, but a cell can also be
identified by fluorescence before analysing its
scatter properties.
3. Realtime Data Processing and Results
The light intensity of each parameter, and with it
the quantity of substance of interest, is assigned
to one of up to 2
16
or 65536 quantity classes
(channels). The classification is performed in
realtime, while the cells are passing the flow
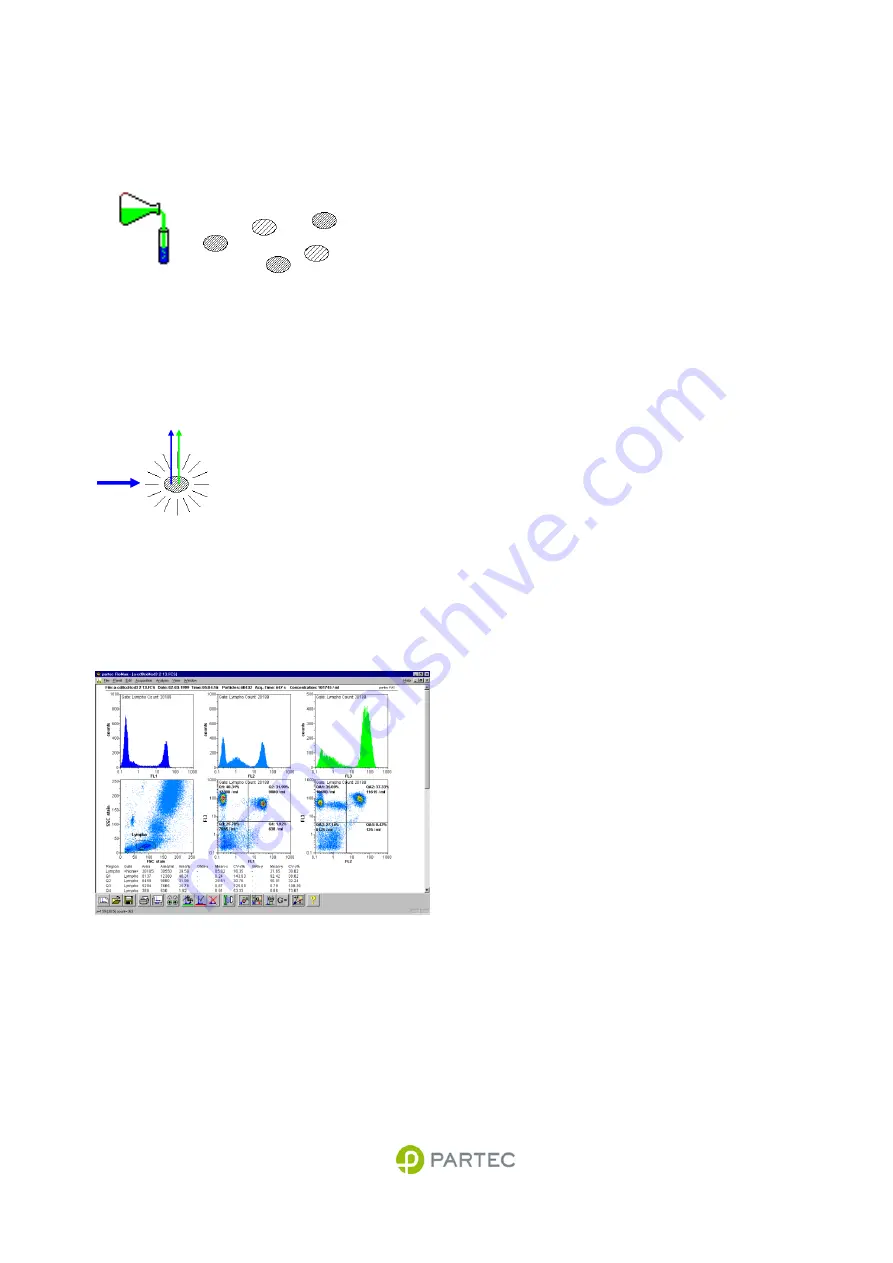
cuvette. Single parameter histograms show the
number of cells within the channels. Two
parameter dotplots show the correlation between
two cell properties.
4. Absolute Cell Counting
Since the CyFlow
®
space analyses all cells
passing through the flow cell while precisely
monitoring the fluid volume of the sample, it
allows volumetric counting during the analysis, i.e.
the determination of concentration of any cell
subpopulation. Cell subpopulations can even be
defined and their concentration analysed at a later
date, after reloading data from a file.
Содержание CyFlow space
Страница 1: ...CyFlow space Instrument Operating Manual...


