


FTIR3 Oil Analyzer
20
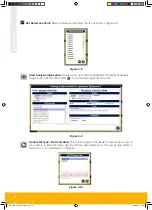
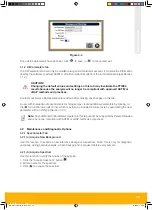
Figure 3-12
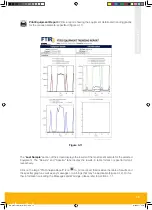
3.1.2 (b) “Trend” Tab
The
Trend
tab (Figure 3-13) displays the history of each oil parameter in graphic form, of percentage
change from the reference plotted against the sampling interval (hours, km, etc.).
Figure 3-13
Click on a parameter from the list on the left-hand side to view the graph for that parameter alone.
To view multiple parameters at the same time, hold down the
Ctrl
key and click on the desired param-
eters. Each selected parameter will be overlaid in a different colour on the spectral graph window.
MA-K31014-KW FTIR Issue 1.indd 20
14/03/2017 20:16


