


2. Web Server Interface
2-46
April 2003
8300-A2-GB20-00
Rate Peak – the peak data rate for the viewed period (see below)
Rate Average – the average data rate for the viewed period (see below)
The Period Index field is used to define the period of time for which the Traffic
Meter statistics will be reported. It represents the 24-hour, 15-minute buckets
index. Selecting a period and then clicking the Submit button will display the traffic
meter statistics for that period. The user-selectable options are listed below.
Click on the All Traffic Meter Intervals button to see the screen shown below in
Figure 2-37
.
Figure 2-37. All Traffic Meter Stats (All Intervals) Screen
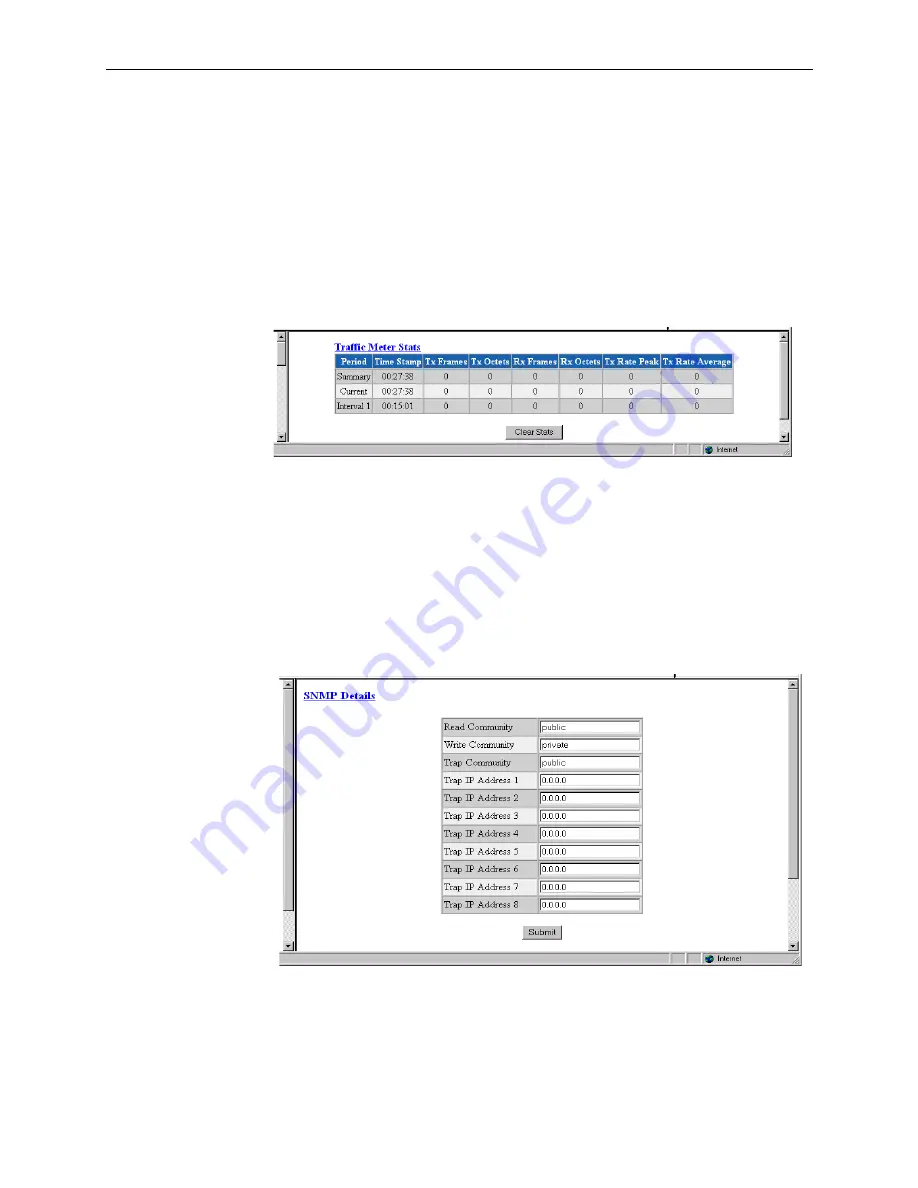
SNMP
The unit detects and reports E1 network alarms and provides several options for
reporting them, one of which is SNMP traps. When a network alarm occurs, the
unit sends a trap message to as many as eight destinations on your network. The
unit will report each alarm by transmitting an SNMP trap to each non-zero Trap IP
Address. The SNMP Details screen (
Figure 2-38
) lets you configure the SNMP
parameters described below.
Figure 2-38. SNMP Details Screen
Read Community
Accepts a character string identifying the group authorized to perform read
operations. The default setting is Public.


