3-15
3.9 Menu Tabs
3.9.1 File Menu
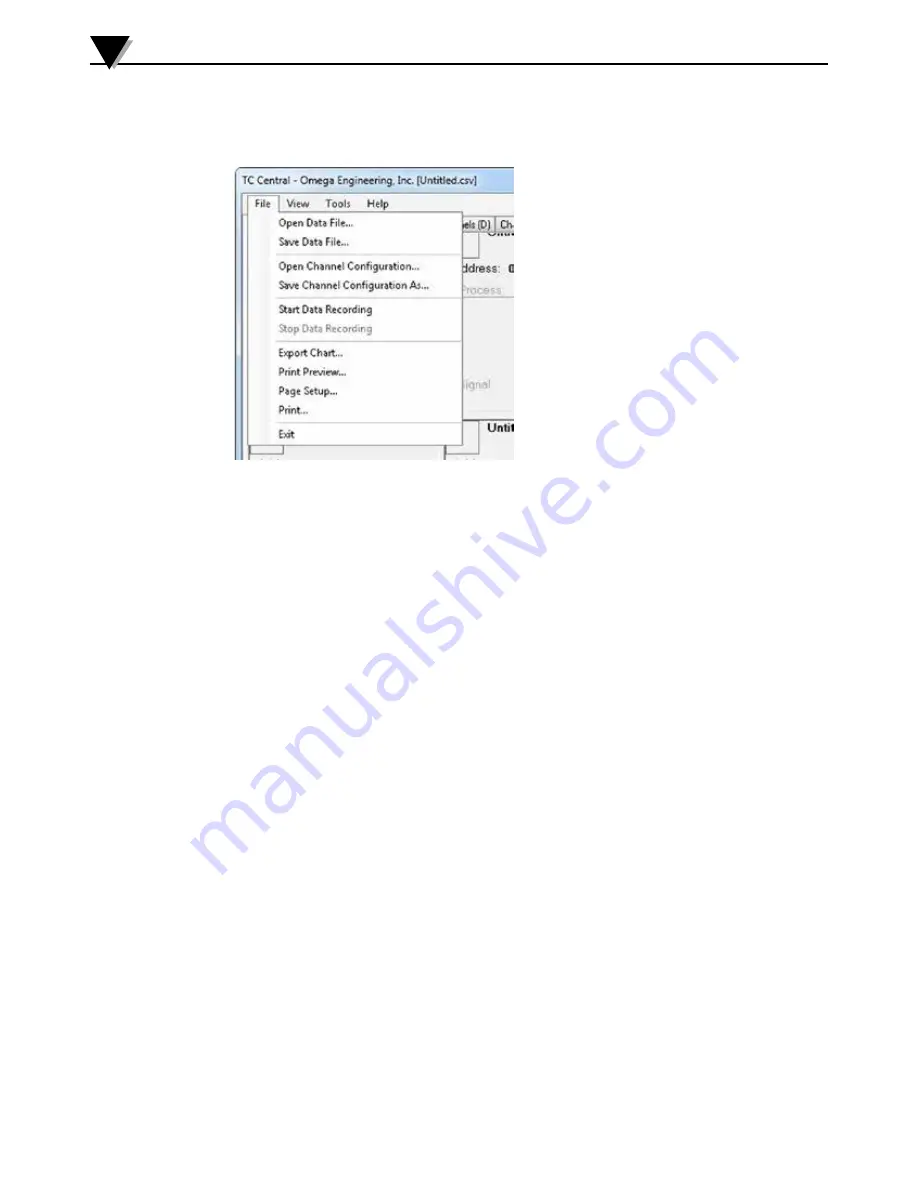
Figure 3-18.
File Menu Screen
Open Data File...
Displays a dialog box which allows you to choose a data file to open and
display on the chart and in the data log. This file must be a file that was saved
by the Save menu item in TC Central. If the file has been modified externally,
you may not be able to open it.
Save Data File...
Displays a dialog box which allows you to save the data currently displayed
on the chart and in the data log. The file format is either tab separated (*.txt)
or (*.csv) (comma separated values), which can be opened by Microsoft Excel
for further analysis and charting. It is strongly recommended that you do
not modify this file, or you may not be able to open it again in TC Central.
Use Excel’s “Save As” option to save it as a Microsoft Excel Workbook (*.xls),
which you can then modify.
Start Data Recording…
Performs the same function as the Start button on the Chart and Data Log
Tabs.
A dialog box is displayed allowing you to select one or more channels to be
plotted and logged by checking the checkbox next to the channel number. You
can also change the color of each channel’s line.
The interval should be set as desired for your particular needs. The total
logging time is displayed for the interval setting selected. In general, the
interval should normally be set to a value equal to or greater than the
“Seconds per Sample” you configured into the transmitter using the UWTC
Configuration Wizard.
You can choose to have the data logging/chart recording session end after 1000
data points, or have the session run continuously. After 1000 data points have
been collected in the continuous mode, the oldest data point is shifted out on
the left, and the newest data point is added to the right. Data will continue
Software
3


