TagTemp- NFC
NOVUS AUTOMATION
8/9
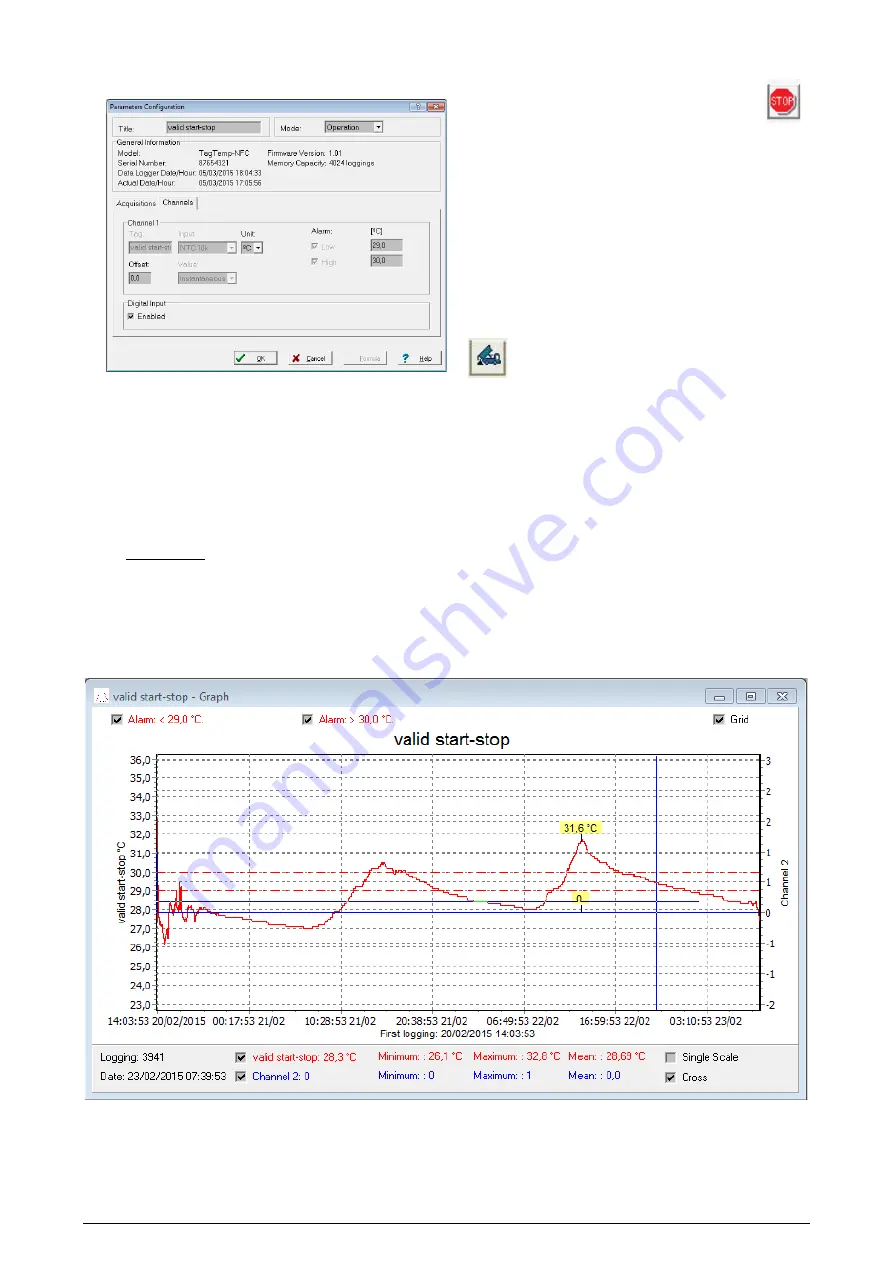
4- Channels: Displays other parameters related to temperature
measurement:
Fig. 24 – Configuration Parameters screen
Unit: Defines the unit of the value measured: ºC or ºF for
channel 1 (temperature).
Value: Define the recorded value will be the instantaneous
value, i.e., the stored value is equal to the measured value.
Measurement occurs at the end of the defined interval. The
minimum interval between records is 1 minute.
Offset: Makes possible to correct the value logged.
Alarm: Defines limit values that, when exceeded, characterize
an alarm condition. Alarm events are informed to the user
through a flashing mode of the Alarm Indicator.
After filling all the fields select “OK” and settings will be sent to the
equipment.
Stop Button
The stop button is enable with a fully configured device.
The Stop button allows stop records permanently, so that the device
will only register again after a new configuration by the user.
6.4
Offloading and data visualization
Data collected are send from equipment to PC. Data can be collected
any time, at the end of the acquisition process or while they are being
acquired. If data collection takes place during the acquisition
process, the process will not be interrupted, following the equipment
configuration.
It is important to "wake up" the equipment before starting
communication.
6.5
Offloading data
Data offload is accomplished by clicking the button Offload Data:
During data transference, a status bar indicates remaining data to be
transferred. Data offloading time is proportional to the number of
readings logged.
6.6
Visualizing data
At the end of values transfer, data can be displayed in a graphical
form.
6.6.1
Chart Window
It is possible to select a region of the chart to zoom in. Zoom
commands can be accessed through the View menu or through
zoom icons from the task bar.
It is also possible to select an area from the chart to zoom in by
clicking and dragging the mouse, thus creating a zoom region
starting from the upper left corner on the chart area.
The graphic curves can be vertically dragged with a right-click and
dragging the mouse up and down.
Fig. 25 - Visualizing Data screen


