Nordic ID Group
| Joensuunkatu 7 | FI-24100 Salo |Finland
358 2 727 7700 | Fax + 358 2 727 7720 | [email protected]
25 / 40
2022-04-04
Nordic ID FR22 User Guide
Version 1.0
6.3.
DASHBOARD
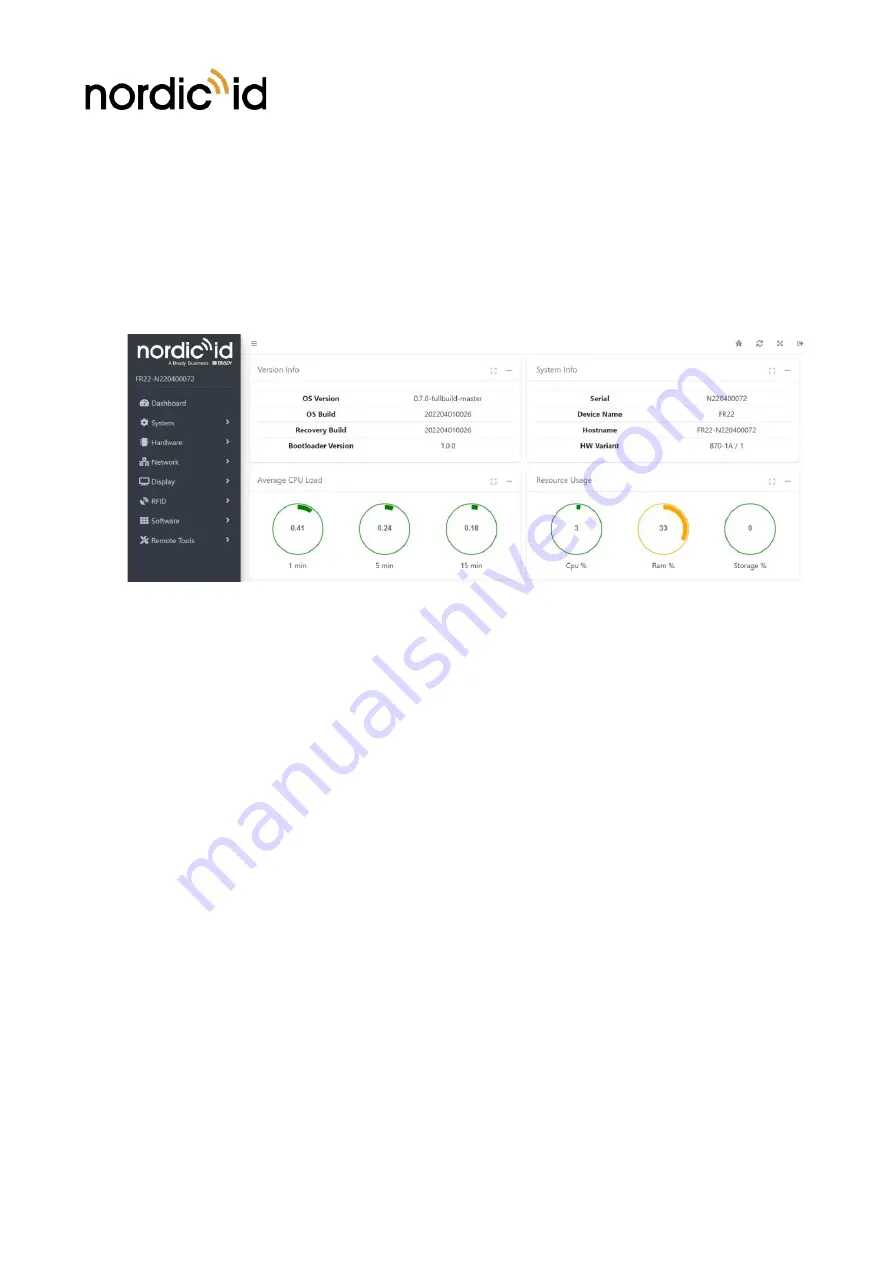
The default landing page is the dashboard, where you can see the system status and health monitor in
real time. Visually, green metrics indicate that the device is behaving as expected. Red metrics would
require immediate action on the physical device, environment, or software applications to solve the
issues.
This page is shown every time you connect to the device web UI, but you can configure any other page
or application to be shown by default instead of the dashboard, as explained in section 0.
Screenshot 7 Main dashboard in web UI
6.4.
SYSTEM MENU
The system menu has six sections, most of them meant for developers.
•
API docs
o
Describes the functions of the system APIs to control the reader.
•
Date.
o
It shows the current system time and allows adjusting the date and time settings.
o
Date and time can be adjusted manually or automatically using NTP servers.
o
Time zone must be set manually.
•
Log.
o
It shows the logged events and allow to download them for debug purposes.
o
Events can be filtered by severity and application/service (started by user, Nordic ID or
system) that created the event.
•
Settings (only for Factory Reset)
o
See section 6.4.1.


