3
SafeGuard Controller User Manual
MAN-0115 Rev 0
1.1
DATA DISPLAY SCREENS
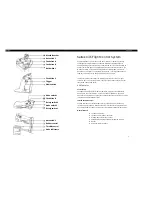
The SafeGuard Controller offers 3 distinct graphic displays for depicting the monitored
data. These are Bar Graphs, 24 Hour Trend and Combination. Each is shown in Figure
2.0.
1.1.1 TREND
SCREEN
The SafeGuard Controller’s Trend screen shown in Figure 2.0 displays a 24 hour trend of
input data for the channel selected. Horizontal tic marks are each hour and vertical tic
marks are each 10% of full scale. Dashed lines indicate alarm levels. The graphic LCD
is 240 pixels wide so each pixel represents 1/10 hour, or 6 minutes worth of data. The
trend is 100 pixels high so each represents 1% of full scale in amplitude. Since each data
point must be collected for 6 minutes before it may be displayed, it is likely input values
will fluctuate during this interval. Therefore, MAX, MIN and AVERAGE values are
stored in RAM memory for each 6 minute subinterval. To accurately portray the trend, a
vertical line is drawn between MIN & MAX values for each 6 minute subinterval. The
AVERAGE value pixel is then left blank, leaving a gap in the vertical line. This is
demonstrated in the
noisy
area of the 24 hour trend in Figure 2.0. If the MAX & MIN
values are within 2% of each other there is no need for the vertical line and only the
AVERAGE value pixel is darkened as in the
quiet
areas.
The top portion of each trend screen indicates channel #, real time reading in engrg. units,
measurement name, range, and MIN, MAX & AVERAGE values for the preceding 24
hour period. The SI field on the top right indicates number of seconds remaining in the
current 6 minute subinterval.
1.1.2
BAR GRAPHS SCREEN
The SafeGuard Controller’s Bar Graphs screen shown in Figure 2.0 allows all active
channels to be viewed simultaneously. Both engineering units values and bar graph
values are indicated in real time. Lines across the bars indicate the alarm trip points
making it easy to identify channels at or near alarm. A feature in the Systems menu tree
allows new alarms to always force the LCD to the bar graphs screen. This is useful for
applications requiring channels with alarms to be displayed.
1.1.3 COMBINATION
SCREEN
The SafeGuard Controller’s Combination screen shown in Figure 2.0 offers a view of a
single channel but displays the data as a 30 minute trend, bar graph and large engineering
units. It is also useful for testing inputs for stability since MAX, MIN & AVERAGE
values refresh each time this screen is selected. For example, to test stability over a one
hour period for an input, begin timing as soon as the channel is selected. One hour later
record the MAX, MIN & AVERAGE values. The difference between MAX & MIN
indicates peak to peak excursions over the one hour period and AVERAGE is the average
for the hour. Longer or shorter tests may also be run. The numeric value shown below
the bar-graph indicates number of minutes samples have been taken. After 999 minutes
the AVERAGE buffer overflows and the error message
UPDATE
appears in the
AVERAGE field. Exiting this screen resets the buffer and clears the error message.
Содержание SAFEGUARD CONTROLLER
Страница 1: ...MAN 0115 REV 0 August 13 2009 SAFEGUARD CONTROLLER User Manual Revision 4 4 Firmware 6 03 later...
Страница 33: ...30 SafeGuard Controller User Manual MAN 0115 Rev 0 Figure 4 2 Note The Printer Option is not used at this time...
Страница 41: ...38 SafeGuard Controller User Manual MAN 0115 Rev 0 Figure 6 3...


