


4.3
Energy Func
�o
ns
A menu bar locates on the top of the screen. Di
ff
erent screen pages on energy and power
can be called by pressing on these menu bu
�
ons.
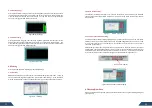
4.3.1 T
od
ay’s Energy
Pressing this bu
�
on will display the power-
�
me curve screen (seeFigure 5). The x-axis
represents the
�
me (4:00-20:00), and the y-axis represents NEP micro inverters (BDM-250)
output power (kW). The total output energy (kWh) is displayed on the upper le
�
corner. The
real-
�
me output power (kW) and today's total energy generated (kWh) are displayed on the
upper right corner. Part of the curve can be magni
fi
ed by drawing a box on the curve using
fi
nger or touch pen. Pressing the Today's Energy bu
�
on again cancels the enlarged display
and restores the original display.
Figure 5 Today’s Power
Figure 6 Drawing a box on Today’s Power
4.3.2 Last 7 Days’ Energy
Pressing this bu
�
on will bring up a bar chart showing power genera
�
on over the past 7 days
(see Figure 7).The x-axis represents the date and the last one corresponds to today.The y-axis
represents the amount of energy generated (kWh) on the day.
Figure 7 Last 7 Days’ Energy
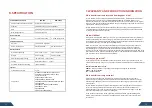
4. USER INTERFACE
4.1 Main Interface
BDG-256/BDG-256P3 takes approximately 1-2 minutes to start up a
�
er power has been
turned on. A
�
er start-up, the system will enter the main interface shown in Fig. 3 (all three
numbers will read “0” at start-up for the
fi
rst
�
me).
Figure 3
BDG-256/BDG-256P3 Main Display
Figure 3shows the BDG-256/BDG-256P3 main interface. The main interface is arranged in
three horizontal rows, which consist of the tool bar at the very top, the display area in the
middle, and the status bar at the lower part of the screen. The tool bar contains 7 bu
�
ons:
Save/Clear (backup/restore factory defaults), Summary Display (summary display interface),
Today's Energy (current day power genera
�o
n), 7-Day's Energy (power genera
�o
n over the
past 7 days), Monthly Energy (power genera
�
on over each month), Yearly Energy (power
genera
�o
n over each year), and Se
�
ngs. These bu
�
ons are used to display their respec
�
ve
content in the middle display area. The display area shows the power-
�
me curve for the
current day as well as a power genera
�o
n bar chart. The status bar shows the device status,
IP address, and current date.
4.2 Interface Overview
If the main interface is idle for 2-3 sec., it will switch to a numeric summary interface, which
is described below: The screen is divided into three parts. The upper part shows Today's
Energy (current day power genera
�
on), the lower right corner shows Life
�
me (total power
genera
�o
n since device started recording), and the lower le
�
corner shows CO2 reduc
�o
n
(reduc
�o
n in carbon dioxide emissions). Touching any part of the screen will bring up the main
interface.
Figure 4
BDG-256/BDG-256P3 System Summary Display
06
05