


AN-48-003 Rev. H (Jun 09, 2022) This document and its contents are the property of Mini-Circuits ECO-013719 Page 41 of 44
4.2.1
Pulse profiling display options (Fig.4.2)
The menus at the top of the pulse profile displays provide the following options:
Screenshot
Select “File” from the menu to save the graph image as a jpg file or copy to the clipboard
(either the selected graph or all open windows).
Scale
Select “Auto” to reset the y-axis (power) to display the full signal being measured, or
“Manual” to open the configuration window where the max level and dB / div settings can be
customized.
Continue / Hold
Click to toggle between continuous live measurements and hold, to freeze the display and
all measured parameters.
Colors
Select from a list of alternative color combinations for the background and signal traces.
Help
(at full trace)
Accessible on the full pulse profile display. Displays the help file with a summary of all
window functions.
Zoom Pulse
(at zoom trace)
Accessible on the “zoom on pulse” display. Select “Auto” to center the zoom on the first
identified pulse, or “Config” to manually set the zoom display parameters (see
section
4.2.2
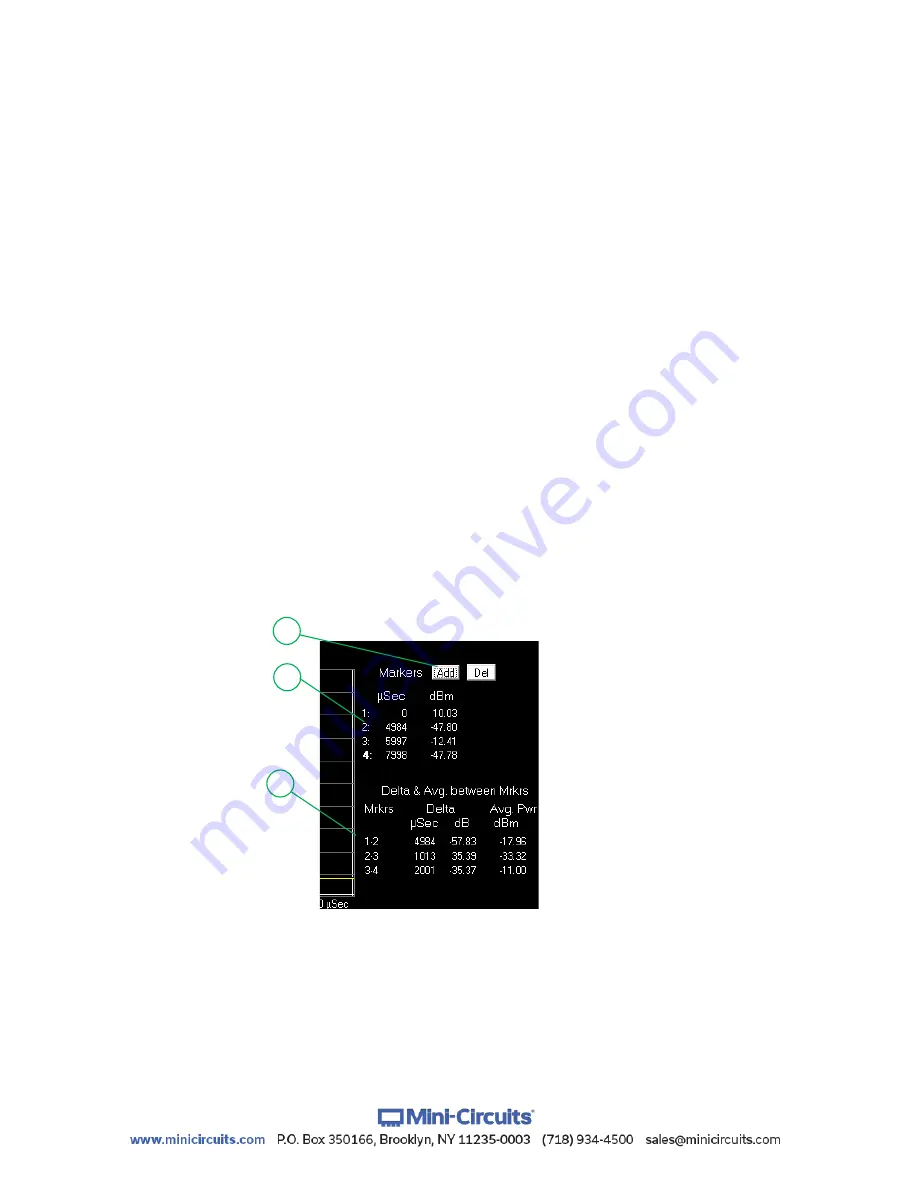
Markers for Graphs
To the right of each graph is a Markers table showing up to four markers with the time
from the start of the sample period (in µs or ms), and the power level in dBm.
•
To add or delete markers click on the
Add
and
Del
buttons at the top of each table.
•
To place the marker automatically at the highest signal peak visible in the trace, double
click on the marker number.
•
To manually place the marker, select the marker by clicking once on the marker number
(number will become bold indicating it was selected) and then click in the graph at the
location you wish to place the marker, or use the keyboard left and right arrow buttons
to adjust the marker location.
•
Markers are placed independently in each graph.
Figure 4.2.2:
Marker table
1
2
3


