4
Avoid placing the weather station in the following areas:
•
Direct sunlight and surfaces emitting and radiating heat, such as heating ducts or air conditioners.
•
Areas with interference from the wireless devices (such as cordless phones, radio headsets, baby listening devices, etc.) and
electronic appliances.
Custom Settings
You weather station will function without additional settings. These custom settings allow more detailed settings and alerts. We will take
each section individually.
Pressure and Weather
Note:
Wait at least 15 minutes after initial set up to view pressure or altitude information.
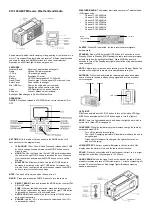
Press the UP or DOWN button arrow buttons on the weather station until the
pressure and weather icon
begins to flash, in the
left corner of the upper display.
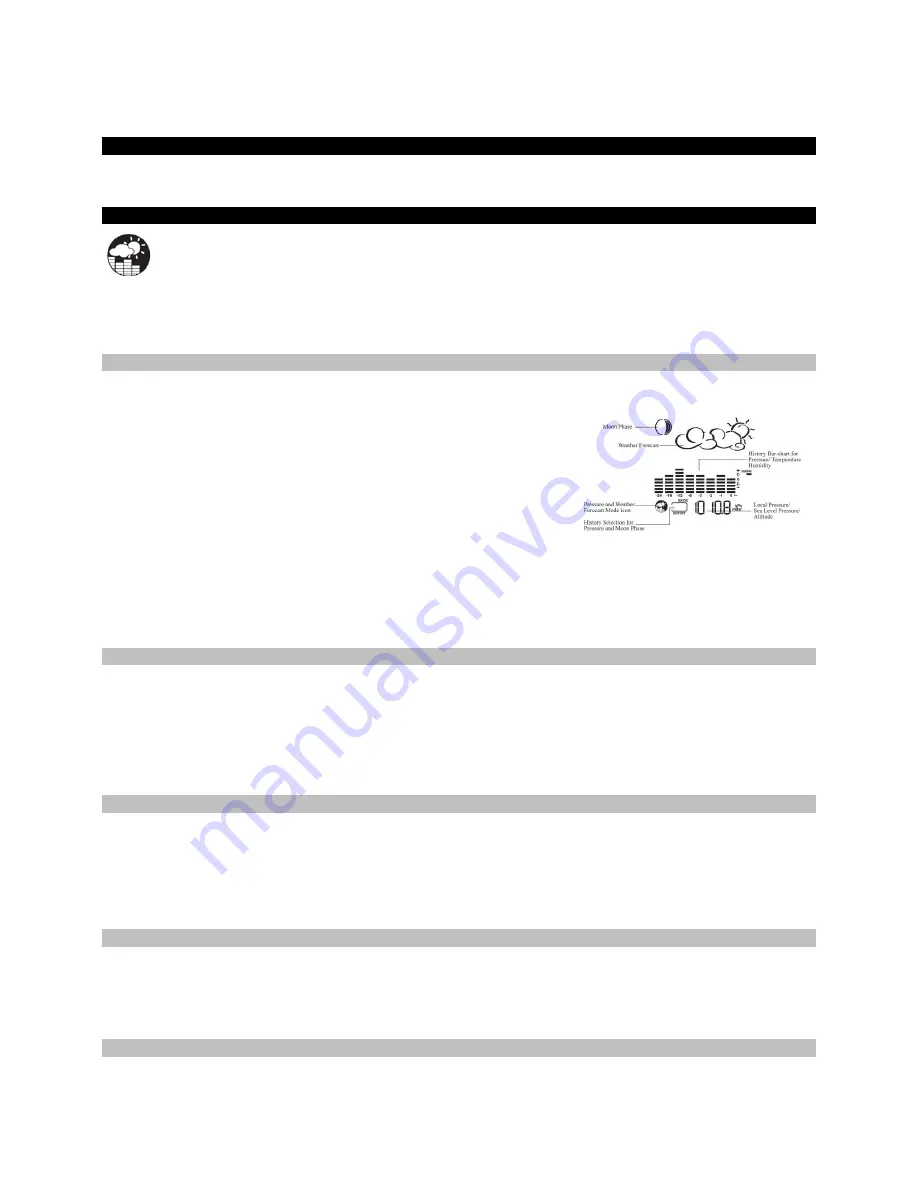
The weather station will display (local) barometric pressure, sea level pressure, and weather forecast and moon phases. Historical statistics
can also be viewed, including the sea-level pressure for the past 24 hours, moon phase for the past and following 39 days, and a selectable
bar-chart for viewing pressure/temperature & humidity history. Pressure may be displayed
inHg
(English),
hPa/mBar
(scientific) or
mmHg
(metric). Altitude is displayed in meters or feet.
Pressure and Altitude Information
Pressure and altitude work together, so only set one. The weather station will measure local pressure and calculate the other two
parameters based on the Local Pressure.
Sea Level Pressure and Altitude are interdependent.
•
Adjust altitude and the weather station will calculate sea level pressure.
•
Adjust sea level pressure, and the weather station will automatically calculate altitude.
•
You can only adjust one of the two–either sea level barometric pressure or altitude.
Press and release the SET button to alternate between
•
Sea Level Pressure
•
Local Pressure
•
Local Altitude settings
The default settings are: inHg (Inches of Mercury), and 33 feet. These setting can be changed to local readings.
Local Pressure
reflects pressure changes at your
specific location (house).
The local altitude/elevation must be programmed according
to GPS readings, internet, etc.
Sea Level Pressure
reflects pressure changes in your
surrounding metro area.
The
Sea level
barometric pressure value can be adjusted
according to the local metro area weather information (Sources–local TV, radio station, etc.).
Changing or Setting Sea Level Pressure
1.
Press the SET button until the local pressure with the word “SEA LEVEL” is displayed.
2.
Hold the MEMORY button until the
pressure unit
is flashing, inHg, mmHg or hPa/mBar
3.
Set the pressure units with the UP or DOWN arrow buttons
4.
Press the MEMORY button to confirm your selection
5.
Hold the SET button until the
pressure digits
flash.
6.
Set the sea level pressure using the UP or DOWN buttons to adjust the pressure value. Hold the UP or DOWN arrow buttons for faster
digits advancement
7.
Press the SET button to confirm your selection.
Changing or Setting Altitude
1.
Press the SET button until the local altitude value will be displayed
2.
Hold the MEMORY button until the
altitude unit
is flashing, feet or meters.
3.
Press the UP or DOWN button arrow buttons to set altitude in feet or meters
4.
Press MEMORY button once to confirm your selection
5.
Hold the SET button until the
altitude digits
are flashing.
6.
Set the altitude value with the UP or DOWN arrow buttons. Hold the UP or DOWN arrow button for faster digits advancement
7.
Press the SET button to confirm your selection.
View the Sea Level Pressure History
•
From any mode, press the HISTORY button.
•
When the SEA LEVEL is displayed, press and release the HISTORY button repeatedly to view the sea level pressure history for the
past 24 hours, in hour intervals.
•
If no buttons are pressed for 5 seconds, the weather station will automatically exit history mode and return to the Pressure and
Weather Forecast mode.
View the Pressure, Temperature and Humidity Bar Charts
The pressure bar graph shows barometric pressure variations over the past 24 hours. This is very useful for understanding the Barometric
trends that are used in weather forecasting. Each bar icon represents 0.06 inHg. Alternatively, the bar chart can be used to display 24 hour
trend data for Sea Level Pressure, outdoor temperature or outdoor humidity (channel 1 only).