13
KUNBUS GmbH
KUNBUS Ethernet Test Access Point TAP-2100
3.2.4 Wireshark-Statusfenster
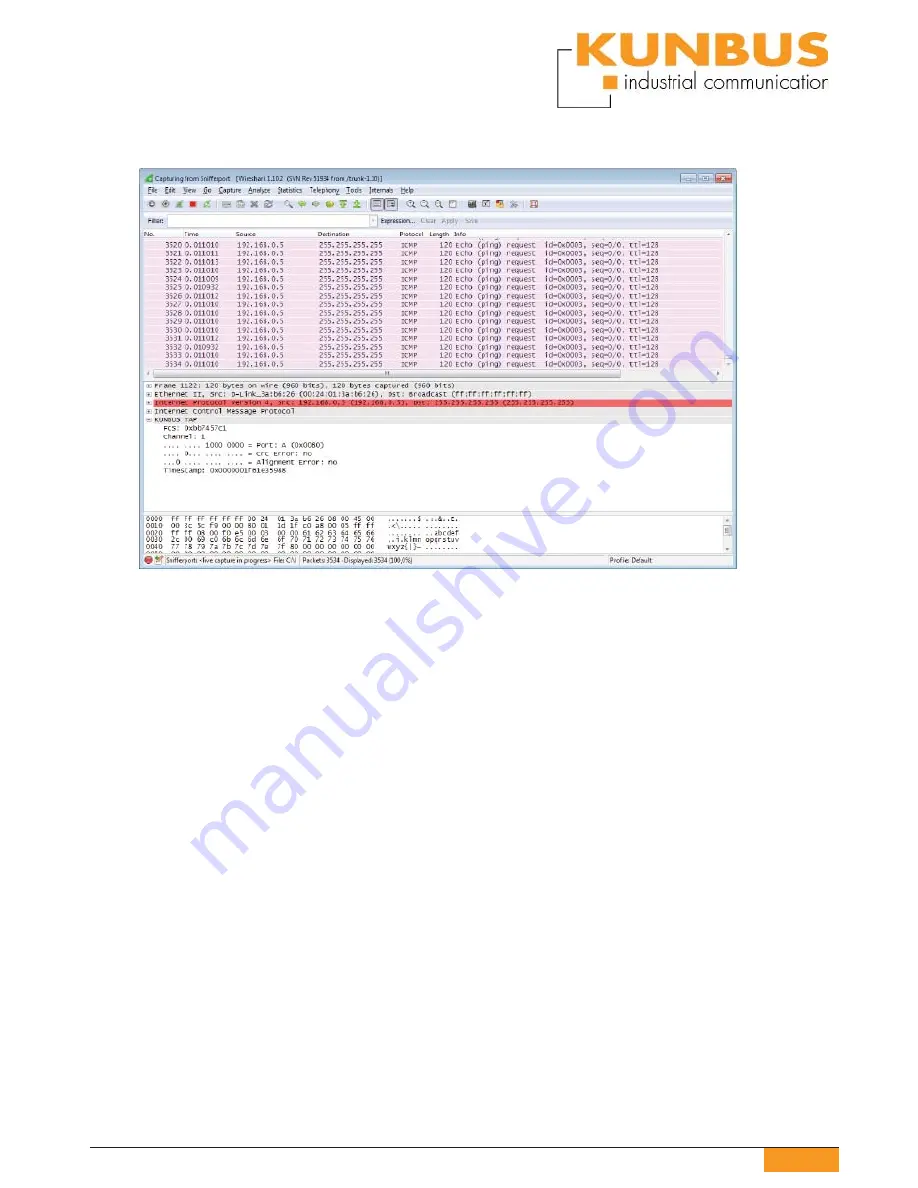
The Wireshark main window consists of 3 parts:
• packet list
• packet details
• packet raw data
3.2.4.1 The packet list
Here, all packets are displayed in chronological order. As soon as the KUNBUS TAP
Spy plugin is activated, the „Time“ column will display the more accurate TAP 2100
time stamp instead of the operating system time stamp.
It is possible to display TAP 2100 values in additional columns. For this purpose, select
the
fi
eld type ‚Custom‘ in settings (Menu Edit/Preferences) under columns. Enter for
example ‚tap.port‘ as the
fi
eld name. As soon as ‘tap.’ has been entered, all possible
values are displayed. A description is provided below. With ‚Add‘, a column can be
added. Using the mouse, the lines can be moved and thus change the order.
To speci
fi
cally evaluate traces, Wireshark offers a
fi
lter function. This allows limiting the
display and analysis to those frames that are the most interesting. For example, with
the
fi
lter the incoming and outgoing data traf
fi
c of your own IP address can be observed.
An exclusive observation of the Ping command can be realized with Wireshark. Here
you can
fi
lter according to TAP additional information. With the
fi
lter expression ‚tap.
port==a‘, for example only packets are displayed that were received at TAP 2100


