


W W W . K A A R T A . C O M
4 5
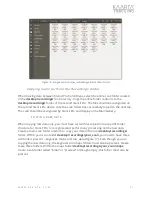
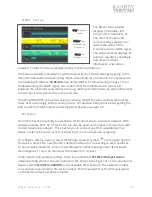
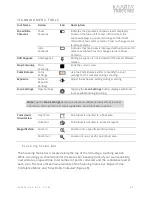
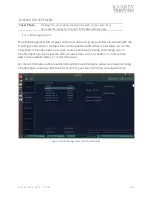
numbers can be used to help understand the density of point data you are collecting
based on the size of the scene being captured.
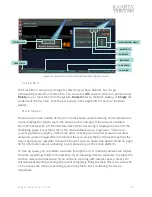
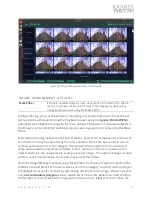
S c a n V i e w
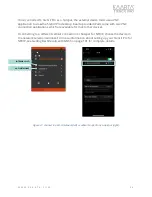
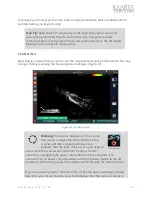
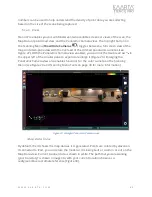
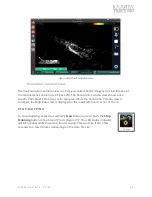
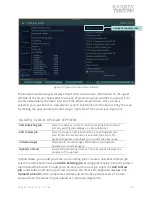
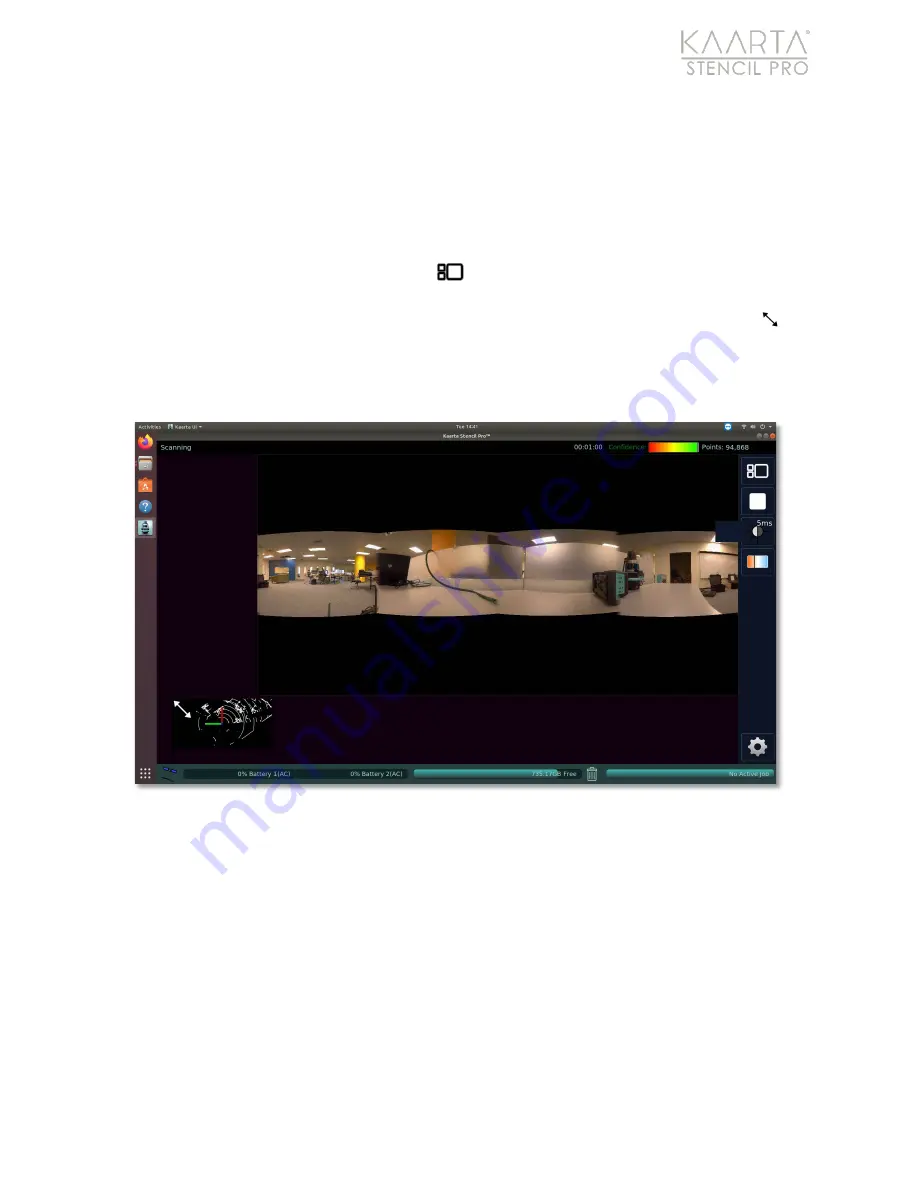
Stencil Pro enables you to switch between two available screens or views of the scan, the
Map Data or pointcloud view, and the Panoramic Camera view. The top right button on
the Scanning Menu (
Show/Hide Cameras
) toggles between a full screen view of the
map and a two-pane view with the live feed of the stitched panoramic cameras (see
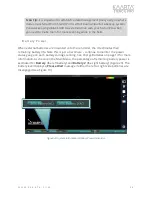
Figure 27). With the Panoramic Camera view enabled, you can click the double arrow in
the upper left of the smaller pane to expand or enlarge it (Figure 29). Enlarging the
Panoramic Camera view also enables functions for the color camera on the Scanning
Menu (see Figure 29 and Scanning Menu Tools on page 43 for more information).
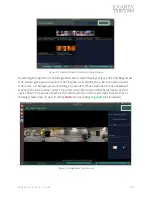
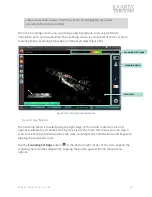
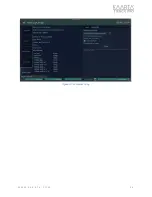
Figure 29: Enlarged Panoramic Camera view.
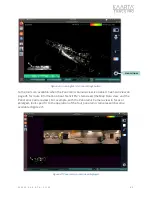
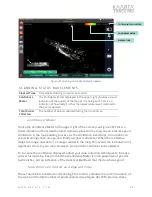
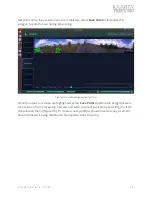
M ap D ata V iew
By default, the UI shows the map data as it is generated. Points are colored by elevation.
If connected to iPad, you can rotate the model as it is being built or zoom in or out on the
Map Data view. Current scanner data is shown in white. The path that you are walking
(your trajectory) is shown in magenta, with your current location shown as a
red/green/blue coordinate reference (Figure 30).