


IG-8
957593
Personal Daq/3000 Series Installation Guide
(5) Collect Data
Click the Enable Readings Column button (17), or the Start All Indicators button (5); the data acquisition
begins and the
readings
column becomes active. Click the Acquire button (12) to send the data to disk.
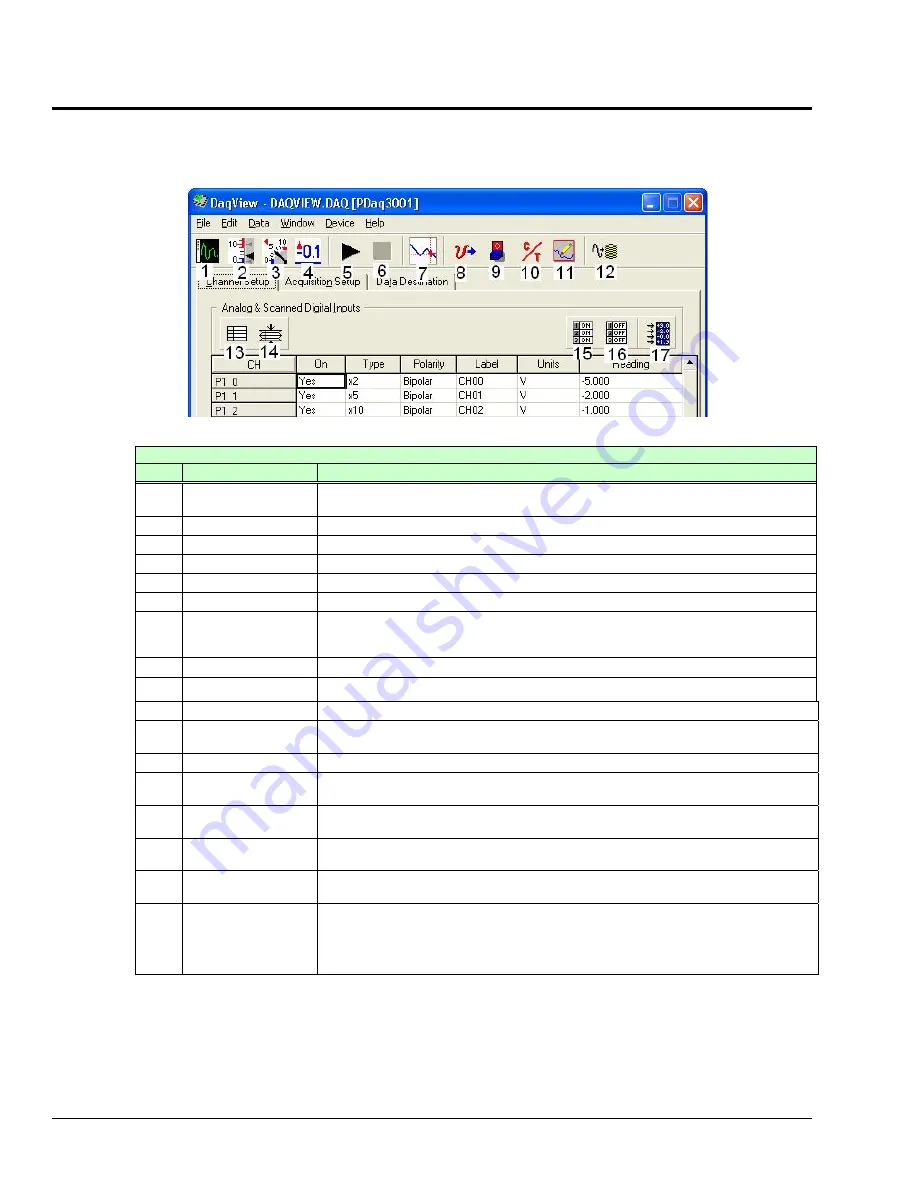
DaqView Main Window
Channel Setup Tab Selected
Main Window, a Brief Description of Button Control Functions
#
Item
Description
1
Scope
can be configured and used
Brings up a window from which Scope and/or Chart displays
for analyzing data in relation to x and y axes.
2
Bar Graph Meters
Displays a bar graph meter.
3
Analog Meters
Displays an analog dial meter.
4
Digital Meters
Displays a digital meter.
5
indow.
Start All Indicators
Starts displaying data in the Reading column and any open Chart or Meters w
6
Stop All Indicators
Stops display
any open Chart or Meters window.
ing data in the Reading column and
7
View File Data
Launches an independent post-data acquisition program, such as
eZ-PostView, if installed. The data acquisition CD includes a PDF version of the post data
acquisition document.
8
Analog Output
Displays the Analog Output window of the available DAC channels.
9
Digital I/O
Displays the Digital I/O window.
10
Counter/Timer
Displays the Counter/Timer window.
11
Output
Waveform & Pattern
Displays the Arbitrary Waveform and Streamed Output windows.
12
Acquire
Activates an acquisition of data to a file.
13
Show
all channels, whether
ALL Channels
Expands Analog & Scanned Digital Inputs spreadsheet to show
active or not.
14 Hide
Channels
INACTIVE
Condenses the Analog & Scanned Digital Inputs spreadsheet, to hide channels that are
inactive.
15
Turn All Visible
Channels ON
Turns all visible channels ON. Hidden channels will remain off.
16
OFF
Turn All Channels
Turns all the channels OFF.
17
s require the Channel Reading column
Channel Reading
A toggle button that enables [or disables] the Channel Reading column of the Analog and
Scanned Digital Input spreadsheet. Some window
to be disabled when changing channels or other parameters. This command is also
available from the Data pull-down menu.
Click one of the toolbar’s display icon
he form of a scope or meter display.
Button (1) brings up the scope window, whi
displays; buttons 2, 3,
an
buttons to see your data in t
ch allows you to set up a scope and chart
and 4 are for: bar graph meters, analog meters, and digital meters, respectively. Note that you c
simultaneously view combinations of display types.


