Web application
PROmesh P20 - User Manual
22
3.4 Start
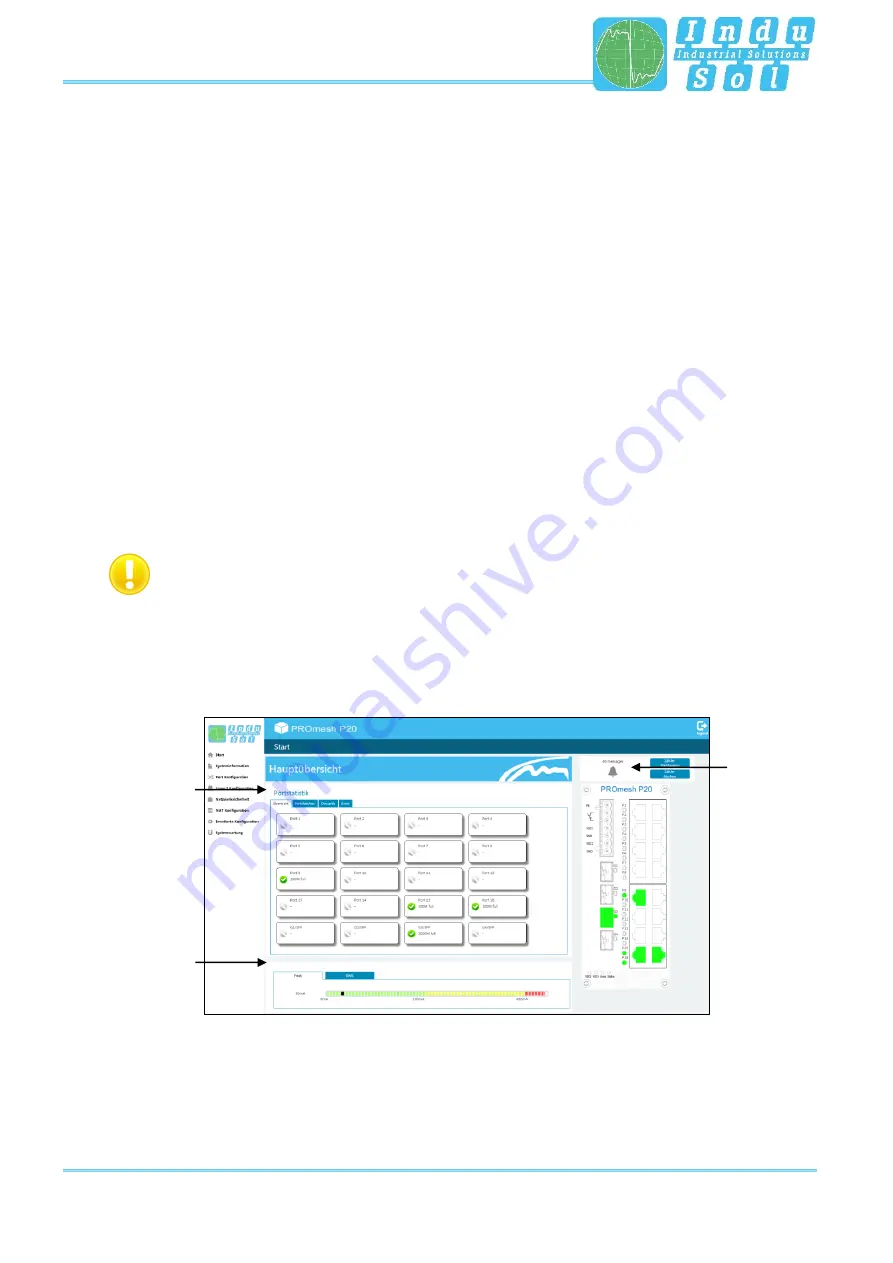
After having logged in successfully, you arrive at the main overview with the information bar in which the
device name, the installation site and the IP address can be viewed. The current user is displayed under
the logout button on the right end of the bar. Press this button to log out and to block the device. The Help
button will show you information and explanations for the individual pages.
In the Port Statistics you will see an overview of the status of the available ports since the start or reset of
the switch. Additionally the corresponding IP address of the communication partner is shown as well. By
selecting the sub-items Network Limit, Discards and Error, you can call up the respective detail information.
The number of messages that occurred is displayed in the Messages window. The entries in the Message
list are opened automatically with a mouse click on the alarm bell. The messages as well as the counter
reading of the ports can be deleted by the respective buttons.
The overview of the leakage current presents the current current value between the RJ45 port and the top-
hat rail of the device. For this, you can switch between the peak value (Peak) and the effective value (RMS).
Interference currents, which can lead to direct communication problems, are made visible early on by this
information.
To enable correct measurement of the leakage current, the top-hat rail has to be earthed
correctly.
The selection in the menu bar allows you to call up individual pages and make settings there. The displayed
menu items are sub-divided into further sub-items.
Figure 8: Main overview
Leakage
current
Port
statistics
Message
window
Содержание PROmesh P20
Страница 1: ......
Страница 34: ...Web application PROmesh P20 User Manual 34 Figure 18 Alarms Notifications Adding an alarm trigger...
Страница 54: ......


