


NanoPhotometer
®
N120/
NP80/N60/N50/C40
User Manual Version 4.3.1
35
graph area. With the header tick box it is possible to select/unselect all samples (maximum
number of sample selection is 30). The second column of the table indicates whether the
measurement is saved ( ) or not saved (blank field).
With the edit button the sample name of a single sample can be edited.
1. Select one sample in the table (selected sample will be highlighted in grey)
2. Push on Edit button
3. Change sample name
4. Confirm with the “Confirm” button
Note:
It is not possible to edit sample names of opened IDS files.
Graph area
The graph area shows a chart with the graph of the actual measurement or the selected
line(s) in the table (tick box selection). There is an overlay toggle switch on the left bottom of
the graph area. If the overlay option is enabled the graphs of the measurements will be
automatically overlaid. To change the overlaid graphs use the tick boxes in the table.
Note:
It is only possible to overlay up to 30 graphs in a chart. If more than 30 data are
selected a message will appear that says
“More than 30 samples have been selected. Only
30 will be shown in graph.
”
Note
: The overlay button is not available on the NanoPhotometer
®
touch screen and
smartphones, only on tablets and computer versions.
It is possible to zoom in and out any area of the diagram (x- and y-axis). Undo the zoom by
pushing the full scale icon (
).
Note:
Maximum zoom is 20 nm for the x-axis and 0.01A for the y-axis.
As legend option the sample name in the table is colored in the same color as the graph in
the chart.
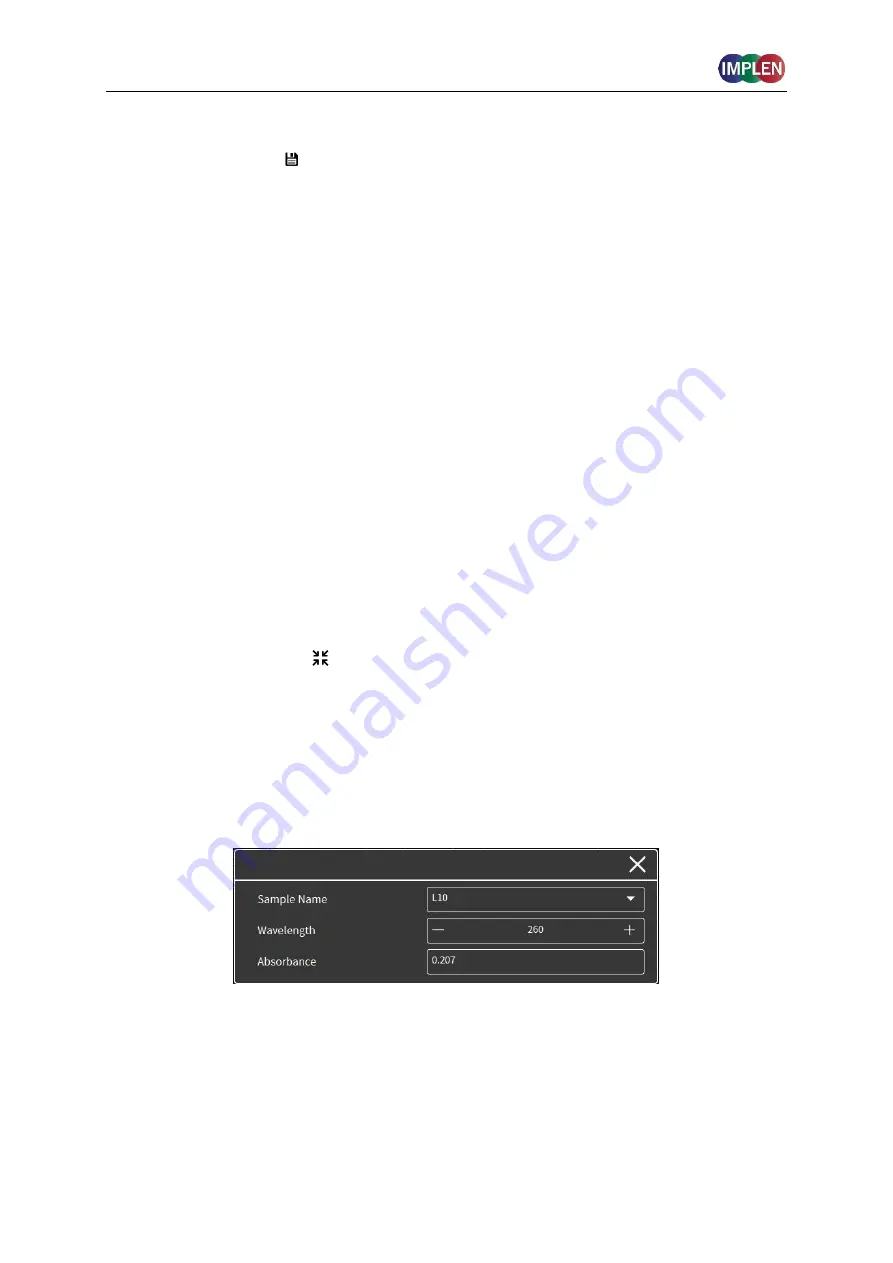
Pushing on the graph opens a pop up which shows the sample name, wavelength and
absorbance of the selected wavelength. It is possible to display the results of other graphs
by changing the sample name with the dropdown option.


