1.
All LCD segments light up: the device works error-free.
2.
"-----": the zero value of the measure is too low (below the minimum)
3.
"Err": overloading or the zero value of the measure is above the maximum.
4.
"LO": Low battery.
5.
"Err-h": percentage of the body fat is above maximum.
6.
"Err-l": percentage of the body fat is below minimum.
Cleaning and Maintenance:
1.
Use a dry, soft cloth for cleaning the scale. If the scale is very dirty, clean it with a cloth damped
with a mild cleaning agent. Do not use detergents containing alcohol or benzene.
2.
Damp surface can be slippery. For your own safety, before using the scale, make sure it is dry.
3.
When in use, the scale should be placed on a solid, level surface, not on a carpet or a matt. Remove
the batteries if you do not use the scale over a longer period.
4.
The scale is a precise instrument with delicate parts and therefore should be taken care of. Do not
jump on the scale, do not drop it.
5.
Do not insert any objects into the openings.
6.
Do not repair the scale yourself. If you try to repair the device yourself, you will lose the warranty.
7.
If the device does not work, check if the batteries have been inserted or used up. If necessary, insert
new batteries, or ask your dealer for help.
8.
If the display shows incorrect messages or does not go out automatically, remove and reinsert the
batteries.
9.
Should the scale be tempered with or exposed to a strong electromagnetic field, so that the data is
lost, the warranty expires.
10. The manufacturer is not responsible for damages or injuries caused by improper use.
Information on the reliability of the results:
The body fat analysis is based on a standard measuring method developed as a result of
comprehensive studies. Measurements are influenced by the water content in the very thin tissues,
individual habits, or:
a.
after taking a bath (values often lower);
b.
after eating or drinking (values often higher);
c.
during menstruation (contrasting results);
d.
dehydration during illnesses or stress which is connected with excessive sweating.
e.
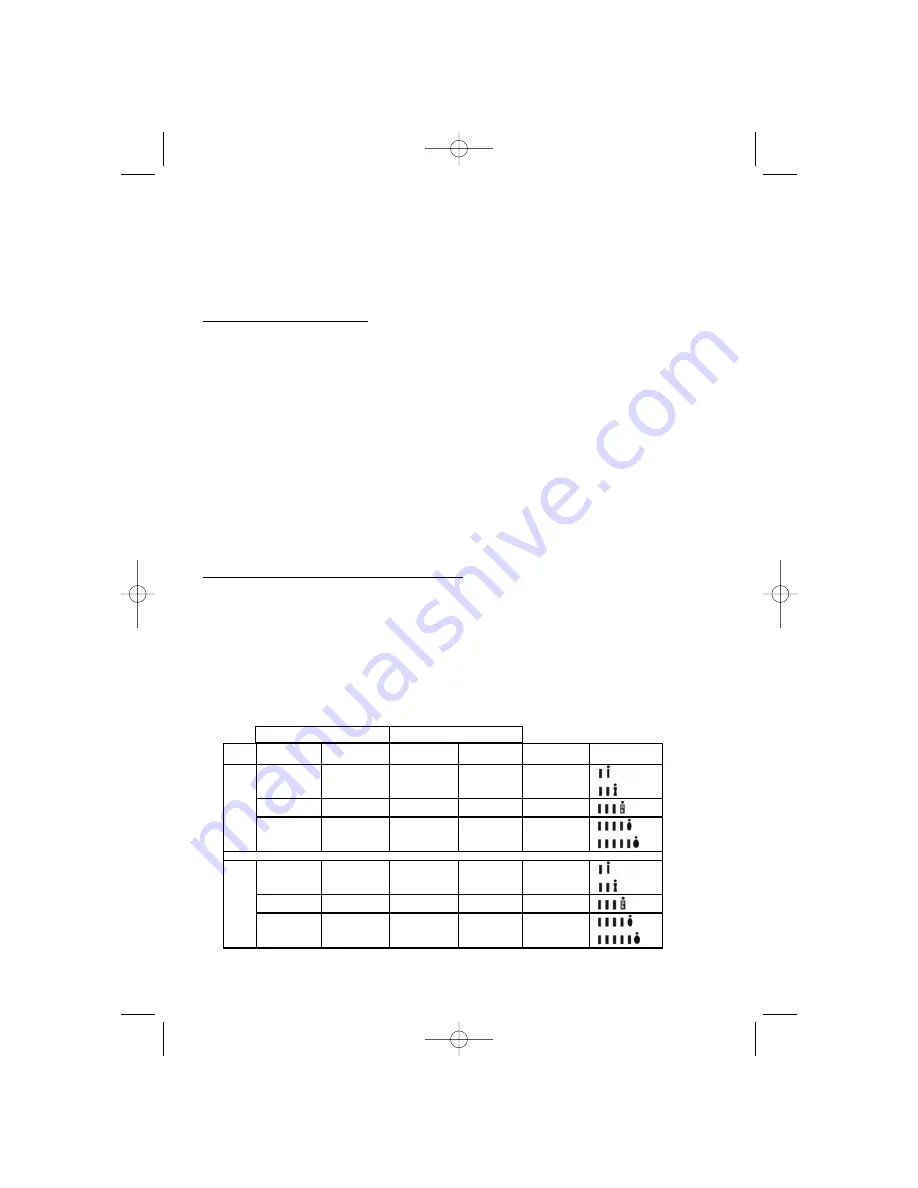
The following table shows the range within which the expected results of fat and water content
analysis can vary:
9
Women
Man
Age
Fat %
Water %
Fat %
Water %
Result
In comparison
Under
30
4.0-16.0%
16.1-20.5%
66.0-57.8%
57.7-54.7%
4.0-11.0%
11.1-15.5%
66.0-61.2%
61.1-58.1%
too low
low
20.6-25.0%
54.6-51.6%
15.6-20.0%
58.0-55.0%
normal
25.1-30.5%
30.6-45.0%
51.5-47.8%
47.7-37.8%
20.1-24.5%
24.6-45.0%
54.9-51.9%
51.8-37.8%
high
very high
Over
30
4.0-20.0%
20.1-25.0%
66.0-55.0%
54.9-51.6%
4.0-15.0%
15.1-19.5%
66.0-58.4%
58.3-55.3%
too low
low
25.1-30.0%
51.4-48.1%
19.6-24.0%
55.2-52.3%
normal
30.1-35.0%
35.1-45.0%
48.0-44.7%
44.6-37.8%
24.1-28.5%
28.6-45.0%
52.2-49.2%
49.1-37.8%
high
very high
2 Body fat scale_EN 4/8/08 3:59 PM Page 9


