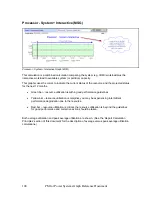
Processor - Interactive Capacity (MSG)
Processor – Interactive Capacity Graph (MSG)
The guideline established for interactive work is reflection of the available system or partition
assigned to interactive work. Some systems are limited in their interactive capability by IBM i
Edition or
interactive feature card
. The guideline shown for interactive capacity is based on the
interactive threshold for that particular Edition or by the interactive feature card. In some
instances, there is no interactive limitation.
This graphic uses the colors to indicate the current status of the resource and the projected status
for the next 12 months.
Green bar – resource utilization is within good performance guidelines
Yellow bar – resource utilization is marginal, you may be experiencing intermittent
performance degradation due to the resource constraint
Red bar – resource utilization is critical, the resource utilization is beyond the guidelines
for good performance and corrective action should be taken.
Both average utilization and peak average utilization are shown. (See the ‘Report Calculation
Principles’ section of this document for the description of average versus peak average utilization
calculations.)
PM for Power Systems Graph Reference Document
99


