

Each nozzle can be identified by
the number of raised ridges on the
inside surface of the nozzle.
Example: 2 ridges = # 42 nozzle
I-40/41 = 3 minutes (approx.)
I-42/43 = 1 minute (approx.)
Each nozzle can be identified by
the number of raised ridges on the
inside surface of the nozzle.
Example: 2 ridges = # 42 nozzle
I-40/41 = 3 minutes (approx.)
I-42/43 = 1 minute (approx.)
I-40 Nozzle Performance Data
Pressure
Radius
Flow
Precip in/hr
Nozzle
PSI
ft.
GPM
40
40
50
60
45'
46'
46'
7.0
8.0
8.5
0.67
0.73
0.77
0.77
0.84
0.89
41
50
60
70
80
50'
51'
52'
53'
10.2
11.1
12.1
13.0
0.79
0.82
0.86
0.89
0.91
0.95
0.99
1.03
42
50
60
70
80
51'
53'
55'
56'
11.0
12.3
13.1
13.9
0.81
0.84
0.83
0.85
0.94
0.97
0.96
0.99
43
50
60
70
80
56'
57'
59'
61'
13.5
15.1
16.1
17.5
0.83
0.89
0.89
0.91
0.96
1.03
1.03
1.05
44
60
70
80
90
63'
65'
66'
67'
20.0
21.8
23.4
24.9
0.97
0.99
1.03
1.07
1.12
1.15
1.19
1.23
45
60
70
80
90
66'
68'
69'
70'
22.7
24.7
26.4
28.2
1.00
1.03
1.07
1.11
1.16
1.19
1.23
1.28
Note:
All precipitation rates are calculated for 180 degree operation.
For the precipitation rate for a 360 degree sprinkler, divide by 2.
I-42 Nozzle Performance Data
Pressure
Radius
Flow
Precip in/hr
Nozzle
PSI
ft.
GPM
40
40
50
60
41'
42'
42'
7.0
8.0
8.5
0.80
0.87
0.93
0.93
1.01
1.07
41
50
60
70
80
44'
44'
45'
46'
10.2
11.1
12.1
13.0
1.01
1.10
1.15
1.18
1.17
1.27
1.33
1.37
42
50
60
70
80
46'
47'
49'
50'
11.0
12.3
13.1
13.9
1.00
1.07
1.05
1.07
1.16
1.24
1.21
1.24
43
50
60
70
80
51'
52'
52'
53'
13.5
15.1
16.1
17.5
1.00
1.07
1.15
1.20
1.15
1.24
1.32
1.38
44
60
70
80
90
58'
58'
60'
60'
20.0
21.8
23.4
24.9
1.14
1.25
1.25
1.33
1.32
1.44
1.44
1.54
45
60
70
80
90
60'
62'
64'
65'
22.7
24.7
26.4
28.2
1.21
1.24
1.24
1.28
1.40
1.43
1.43
1.48
Note:
All precipitation rates are calculated for 180 degree operation.
For the precipitation rate for a 360 degree sprinkler, divide by 2.
Each nozzle can be identified by
the number of raised ridges on the
inside surface of the nozzle.
Example: 2 ridges = # 42 nozzle
I-40/41 = 3 minutes (approx.)
I-42/43 = 1 minute (approx.)
I-41 Nozzle Performance Data – Metric
Nozzle
Pressure
Bars
kPa
Radius
m
Flow
m
3
/hr l/min
Precip mm/hr
40
2.5
3.0
3.5
4.0
4.5
5.0
248
303
352
400
448
496
13.4
13.7
14.0
14.0
14.0
14.3
1.52
1.68
1.80
1.92
2.03
2.13
25.4
28.0
30.0
32.0
33.8
35.5
17
18
18
20
21
21
20
21
21
23
24
24
41
3.0
3.5
4.0
4.5
5.0
5.5
303
352
400
448
496
552
14.9
15.2
15.5
15.5
15.8
16.2
2.16
2.33
2.49
2.64
2.79
2.95
36.0
38.9
41.5
44.1
46.5
49.1
19
20
21
22
22
23
22
23
24
25
26
26
42
3.0
3.5
4.0
4.5
5.0
5.5
303
352
400
448
496
552
15.2
15.5
16.2
16.5
16.8
17.1
2.37
2.54
2.71
2.87
3.01
3.17
39.4
42.4
45.2
47.8
50.2
52.9
20
21
21
21
21
22
24
24
24
24
25
25
43
3.0
3.5
4.0
4.5
5.0
5.5
303
352
400
448
496
552
16.8
17.1
17.4
17.7
18.0
18.6
2.87
3.11
3.33
3.55
3.75
3.97
47.9
51.8
55.6
59.1
62.4
66.1
20
21
22
23
23
23
24
25
26
26
27
26
44
4.0
4.5
5.0
5.5
6.0
6.5
400
448
496
552
600
648
19.2
19.5
19.8
20.1
20.1
20.4
4.47
4.75
5.02
5.31
5.56
5.80
74.4
79.1
83.6
88.5
92.6
96.6
24
25
26
26
27
28
28
29
30
30
32
32
45
4.0
4.5
5.0
5.5
6.0
6.5
400
448
496
552
600
648
20.1
20.4
20.7
21.0
21.3
21.6
5.07
5.38
5.68
6.01
6.28
6.55
84.4
89.7
94.7
100.2
104.7
109.1
25
26
26
27
28
28
29
30
31
31
32
32
Note:
All precipitation rates are calculated for 180 degree operation.
For the precipitation rate for a 360 degree sprinkler, divide by 2.
I-43 Nozzle Performance Data – Metric
Nozzle
Pressure
Bars
kPa
Radius
m
Flow
m
3
/hr l/min
Precip mm/hr
40
2.5
3.0
3.5
4.0
4.5
248
303
352
400
448
12.2
12.5
12.8
12.8
13.1
1.52
1.68
1.80
1.92
2.03
25.4
28.0
30.0
32.0
33.8
20
21
22
23
24
24
25
25
27
27
41
3.0
3.5
4.0
4.5
5.0
5.5
303
352
400
448
496
552
13.1
13.4
13.4
13.4
13.7
14.0
2.16
2.33
2.49
2.64
2.79
2.95
36.0
38.9
41.5
44.1
46.5
49.1
25
26
28
29
30
30
29
30
32
34
34
35
42
3.0
3.5
4.0
4.5
5.0
5.5
303
352
400
448
496
552
13.7
14.0
14.3
14.6
14.9
15.2
2.37
2.54
2.71
2.87
3.01
3.17
39.4
42.4
45.2
47.8
50.2
52.9
25
26
26
27
27
27
29
30
30
31
31
32
43
3.0
3.5
4.0
4.5
5.0
5.5
303
352
400
448
496
552
14.9
15.5
15.8
15.8
15.8
16.2
2.87
3.11
3.33
3.55
3.75
3.97
47.9
51.8
55.6
59.1
62.4
66.1
26
26
27
28
30
30
30
30
31
33
34
35
44
4.0
4.5
5.0
5.5
6.0
6.5
400
448
496
552
600
648
17.7
17.7
17.7
18.3
18.3
18.3
4.47
4.75
5.02
5.31
5.56
5.80
74.4
79.1
83.6
88.5
92.6
96.6
29
30
32
32
33
36
33
35
37
37
38
40
45
4.0
4.5
5.0
5.5
6.0
6.5
400
448
496
552
600
648
18.3
18.6
18.9
19.5
19.8
19.8
5.07
5.38
5.68
6.01
6.28
6.55
84.4
89.7
94.7
100.2
104.7
109.1
30
31
32
32
32
33
35
36
37
36
37
39
Note:
All precipitation rates are calculated for 180 degree operation.
For the precipitation rate for a 360 degree sprinkler, divide by 2.
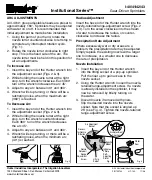
CoRRECT INSTAllATIoN
IDENTIfyINg
NozzlE NUMbERS
fUll CIRClE
RoTATIoN SPEED
Data represent test results in zero
wind. Adjust for local conditions.
Radius may be reduced up to 25%
with adjustment screw (this may alter
the uniformity of the spray pattern).


