26
Quick Start Guide
Plot view
Press
P
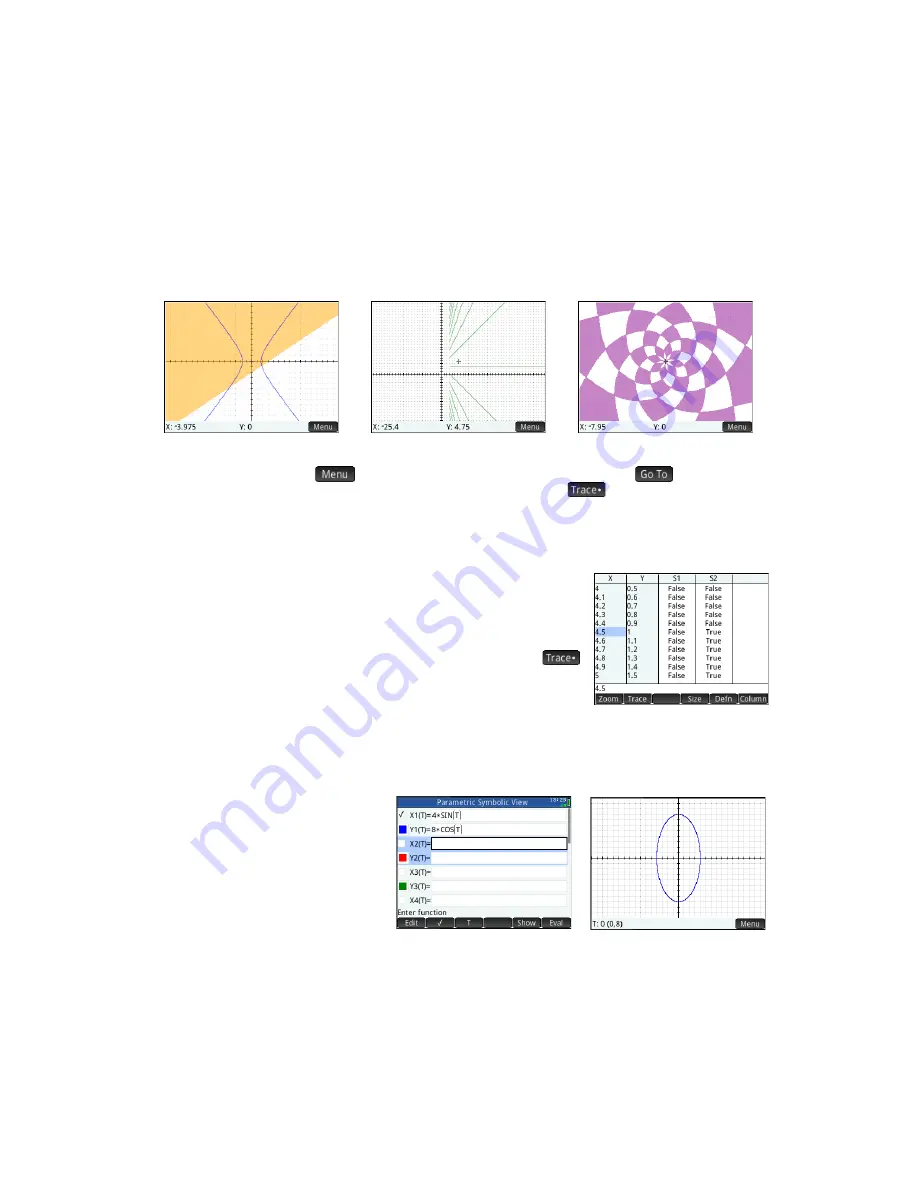
to display the Plot view and see the graphs of the open sentences selected in Symbolic view. The
hyperbola in the first illustration below is S1 in Symbolic view (see above), and the shaded area indicates where the inequality
defined in S2 evaluates to TRUE. The second illustration below shows S3, and the third shows S4. The graph of S4 has been
zoomed in to show some of its finer structure.
The options available by tapping
are similar to those in the Function app. However, the
option lets you
specify both the
X
and
Y
coordinates of the point you want to jump to. Further, the
option opens a menu of trace
options.
Plot Setup view
Press
SP
to display the Plot Setup view. This view enables you to configure the appearance of
graphs. This view offers the same options as the Plot Setup view of the Function app (see “Function, Advanced Graphing,
Parametric, Polar, and Sequence apps” on page 22), except that there is no
Method
field.
Numeric view
Press
N
to display the Numeric view. For various combinations of
X
and
Y
, Numeric view shows whether the open sentence is satisfied. The illustration at
the right shows that the open sentence 2
x
– 3
y
≤
6 (defined as S2 in Symbolic view: see
above) is satisfied when
X
= 4.5 and
Y
= 1, but not when
X
= 4.4 and
Y
= 0.9. You can
enter your own values in the X and Y columns.
The menu items are the same as in the Function app, except that there is also
menu. Options on this menu parallel those in the Plot view.
Parametric app
The Parametric app enables you to define parametric equations and explore their
graphs and tables of values. It is similar in structure and functionality to the Function app. To open the Parametric app, press
!
and select
Parametric
. The app opens in Symbolic view. The information below describes the major differences
between the Parametric app and the Function app (see “Function, Advanced Graphing, Parametric, Polar, and Sequence
apps” on page 22).
Symbolic view
In Symbolic view (
@
) you
can specify up to ten sets of parametric
equations, each one defining
x(t)
and
y(t)
in
terms of
t
. For example,
x
= 4
∙
sin(
t
) and
y
=
4
∙
cos(
t
) form a set of parametric equations.
Note that the
t
must be entered as an
uppercase character (
T
) in this app.
Definitions S1 and S2
Definition S3
Definition S4 (with axes hidden)
Image to come
Содержание Prime Graphing Calculator
Страница 1: ...HPPrimeGraphingCalculator QuickStartGuide ...
Страница 4: ...4 Quick Start Guide ...
Страница 8: ...8 Quick Start Guide ...


