


4.1.3.3. Software Update using cables - ALL controls
(continued)
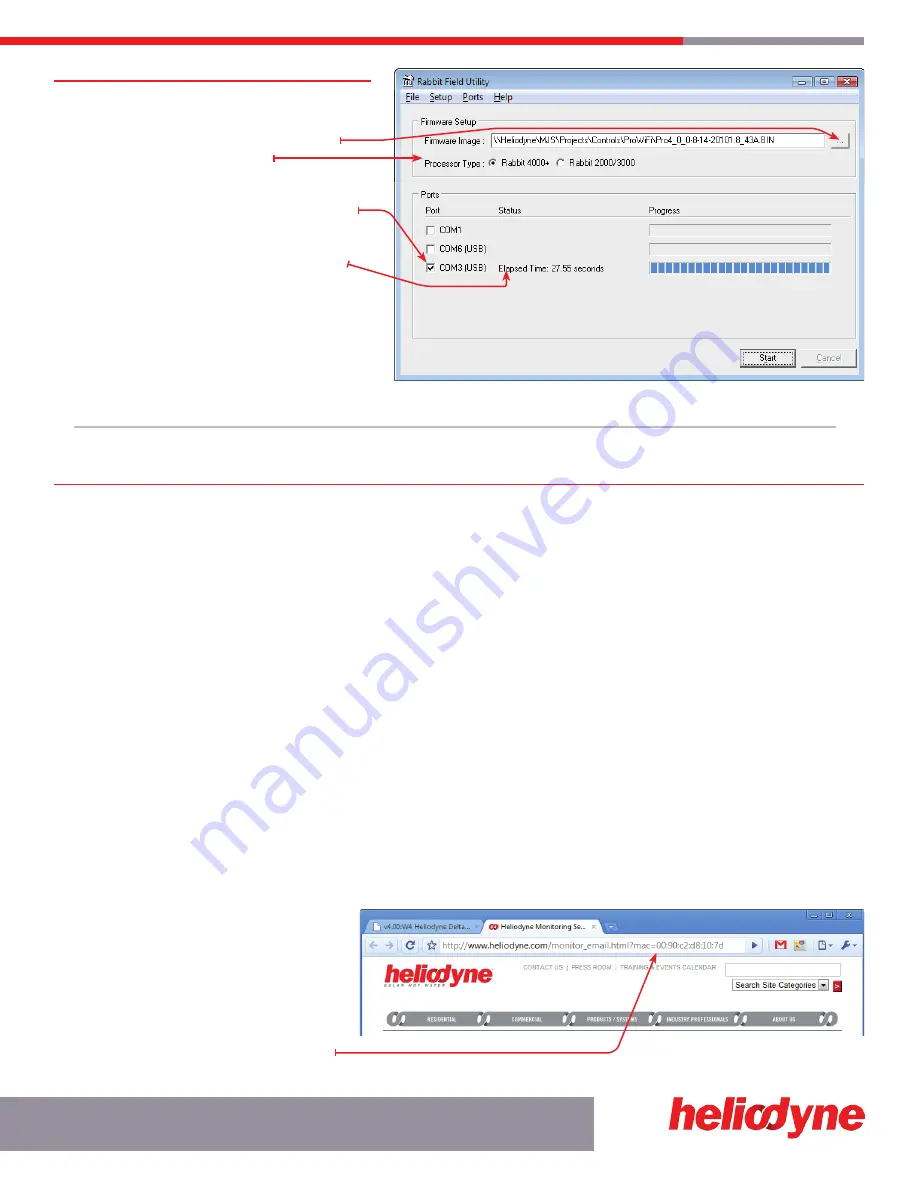
7.
Locate the .BIN file saved on your computer.
8.
Ensure ‘Rabbit 4000’ is checked.
9.
Check the appropriate COM Port that the USB
cable is connected to on your PC. (Device
Manager can tell you or just try it until it works.)
10.
Click on ‘Start’ to begin the software loading.
11.
If the software loaded correctly, you will see the
progress bar at 100% and the ‘Elapsed Time’.
12.
If the software load failed, retrace steps 1-11.
13.
If the software load was successful, once again
disconnect the power from the controller.
14.
Remove the programming cable.
15.
Reconnect power and verify the settings in the
controller are as required. If using Infrastructure
Mode, the controller may have been reset back to
it’s default networking settings; see section 3.0 above.
FIg. 4.1.3.3
UPDaTInG ConTRolleR sofTWaRe
17
S O L A R H O T W A T E R
5. MONItOrING
5.0. Overview
The Controller has two types of monitoring, the built in or Local Monitoring that is stored in the controller’s memory, and the Heliodyne Web
Monitoring service. The Local Monitoring is limited because of the size of the controller’s memory. When the controller is connected to a
network with an internet connection, it communicates with the Web Monitoring service, which is available for viewing performance data and
settings from the WWW; anywhere in the world. It is also possible to change settings, add site pictures and more.
5.1. Local Monitoring
5.1.0. ENErGY Page
In addition to the sensor data graphs on the home page, the controller also displays the last 30 days, and 12 months of accumulated energy
data. More in depth monitoring is provided on the Heliodyne Web Monitoring service. At this point all numbers are in imperial units.
5.1.1. SEttINGS Page - Download System Sensor and History Data
This page displays all the current saved sensor and energy history data for the controller. This is the same data that is sent to the Web
Service. Currently the Pro WiFi Controllers can hold about 30 days worth of sensor history data. the Pro Ethernets: 36 hours and Pro Lites:
24 hours. This data is taken as an average of sensor readings over a complete 10 minute period. (Sensor readings are taken every second).
This data can be saved as a text file and imported into a numbers program. With the browser page open, select all the data and paste into
a text editing program (Notepad for PC’s, Text.app for Mac’s). Filter the data by selecting ‘Comma Delimited’ to get all the numbers in the
correct columns.
5.2. Heliodyne Web Monitoring (http://monitoring.heliodyne.com)
5.2.0. Monitoring Setup
Set the controller in Infrastructure Mode as in section 3. Navigate to the SETTINgS home page, under the SYSTEM bar and click on the
‘Setup System Monitoring’ link. You will be directed to an email form on the Heliodyne website. Fill out all the required fields and send it.
If you are installing multiple controllers for a single
energy producing system, put the MAC address for
each controller so Heliodyne can consolidate the
users and data for those controllers.
Tip: when you click on the link, it saves the
controller’s MAC Address in the browser address
bar, for easy copy and paste into the email form.
Heliodyne will register your controller and send all associated parties an email on login information within one business day.
FIg. 5.2..0


