— 23 —
Software Settings
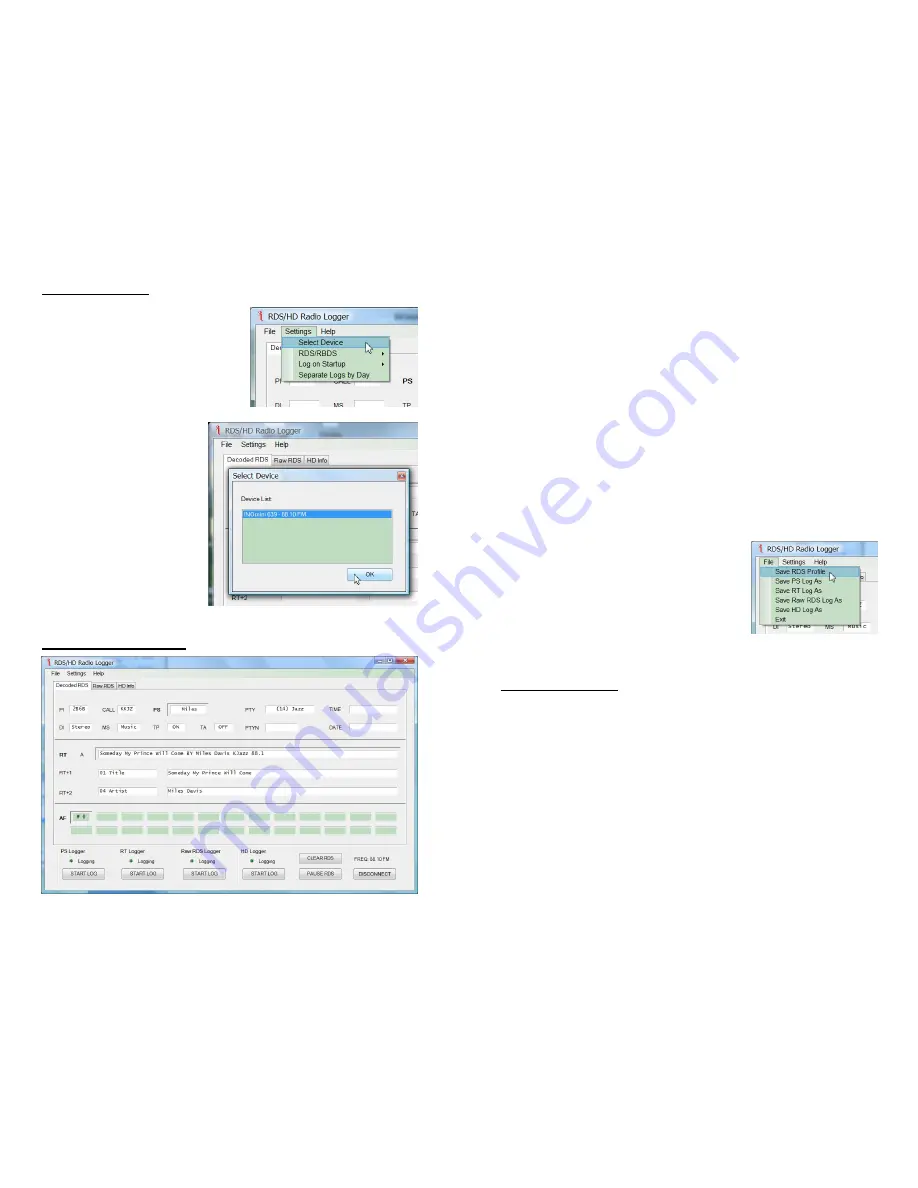
Once the application is run-
ning, you’ll find a
Settings
tab at
the top of the screen. Click
this tab to activate the drop-
down menu illustrated here.
Click the first setting:
Select
Device
to bring up a
Device
List
where connected hardware will
be noted as recognized
by the computer. High-
light the INOmini 639
listing and then click:
OK
.
Next click:
Connect
at the
bottom of the software
screen. The software
will begin to populate
both the analog-FM
De-
coded RDS
and the HD
Radio
HD Info
panes.
You may switch between
these panes regardless
of the listening mode actually selected on the front panel.
The Decoded RDS Pane
— 24 —
This pane displays static and dynamic RDS data, including
the RT+ 1 and 2 ‘tags.’ It is not within the scope of this
manual to detail all the RDS functions. A good source for
this information is the manual for our Model 730 RDS En-
coder, which may be downloaded from the Inovonics Web-
site. The 730 manual gives a good overview of the RDS sys-
tem in general, and goes into fairly extensive detail regard-
ing the various utilities, including RT+ ‘tagging’ technology
and proper use of the Alternative Frequencies (AF) list.
As detailed on Page 16, the call letters displayed in this
pane are back-calculated from the station’s PI code. In the
screenshot, the PI code is accurately derived from call let-
ters and the station is scrolling the PS field with the same
artist and title information shown in the Radio Text field.
This station does include traffic announcements in their
programming, but they do not update time and date or uti-
lize any alternative frequencies (FM translators).
What’s
shown on in this pane amounts
to a ‘profile’ of the station’s RDS
transmission at any given moment.
This profile may be saved on your
computer. Click:
File
at the top of the
screen, and then click:
Save RDS Pro-
file
. You’ll be prompted to pick a
name and folder location for the file,
which will be saved with a .txt extension that may be
opened with Windows Notepad.
The Raw RDS Pane
Clicking the
Raw RDS
tab at the top of the software screen
will take the user to the view shown at the top of the follow-
ing page.
The left-hand
Groups
window displays the contribution per-
centage that each of the fifteen RDS groups makes to the
total data throughput. Group 0 is the most active as it car-
ries the bulk of RDS housekeeping. Percentages are contin-
ually calculated and updated on the fly, but the figure to the
right of the percentages is a running total of occurrences of
each group from the start of the monitoring period.


