DPO6000
,
MPO6000 Series Digital Phosphor Oscilloscope Instruction V1.1
- 62 -
9.Baud diagram(the modes with signal source)
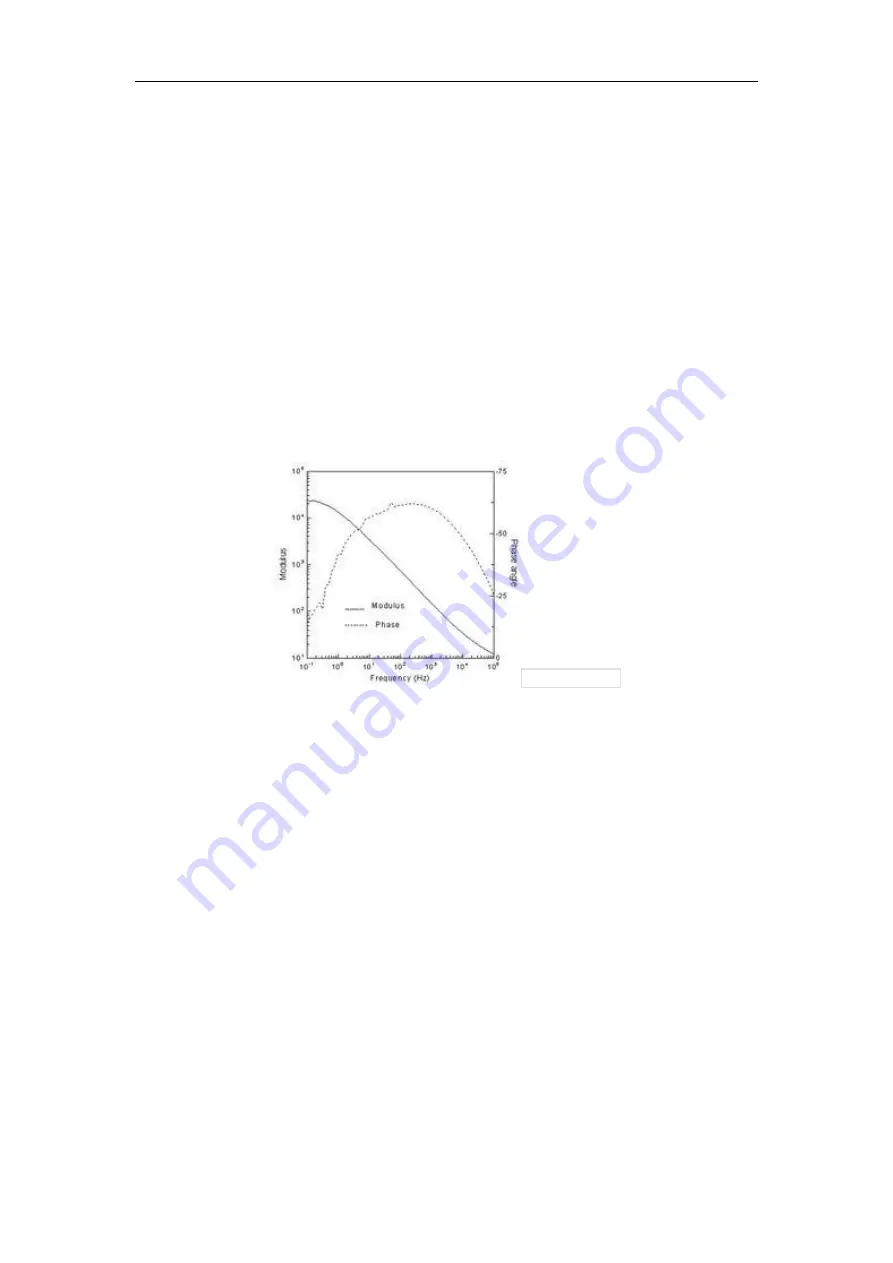
The bode diagram is a semi-log coordinate graph of the transfer function of a linear
time-invariant system with respect to frequency, its horizontal axis is frequency,The
vertical axis is represented on a log scale. The frequency response of the system can be
observed by using the bode diagram.Also known as amplitude frequency response and
phase frequency response curve graph.A bode diagram is usually a combination of two
diagrams,An amplitude-frequency diagram shows the change in the decibel value of the
frequency response gain with respect to the frequency, and a phase-frequency diagram
shows the change in the phase of the frequency response with respect to the frequency.
The figure of the bode diagram is related to the gain of the system, the number and
position of poles and zeros,As long as you know the relevant information, with a simple
calculation can draw an approximate bode diagram, this is the advantage of using the
bode diagram.
9.1.The sketch of the baud diagram
Baud diagram is also known as amplitude frequency response and phase frequency
response curve graph, Generally, it is the rectangular coordinate of amplitude and phase
relative to rotor speed on the fundamental frequency of rotating machinery.
Baud diagram
The logarithmic frequency characteristic is drawn by the method of polyline approximation.
The general drawing method of the bode diagram:
When drawing the baud diagram, it is divided into three frequency bands. The first is the
amplitude-frequency characteristic, and the order is the middle frequency band, the low
frequency band and the high frequency band. Combining the frequency characteristics (or
frequency response) of the three frequency bands to form the amplitude-frequency
characteristics of the full frequency band, and then the corresponding phase-frequency
characteristics are drawn according to the amplitude-frequency characteristics.
9.2.The application of baud diagram
When studying the frequency response of amplification circuit, due to the wide frequency
range of signal (from a few Hz to above a few hundred MHZ), the amplification factor of
amplification circuit is also very large (up to one million times).To compress the coordinate
and expand the field of vision, when drawing the frequency characteristic curve, the
frequency coordinate adopts exponential scale, while the amplitude (in dB) or phase angle
adopts logarithmic scale. The amplitude-frequency characteristics and phase-frequency
curves drawn in such semi-logarithmic coordinates are called logarithmic frequency
characteristics or baud diagram.
The data in the baud diagram contains new (blue) data and old (green) data. The
"sampling noise" in the traditional system can be seen from the diagram.
When analyzing the stability of the negative feedback amplifier circuit in the course of
analog electronic technology, colleges and universities usually adopt the baud diagram
analysis method.


