61
Section 2: Software Installation, System Operation, Data Handling
© 2017 Hansatech Instruments Ltd
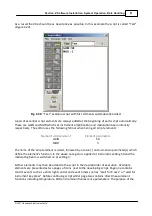
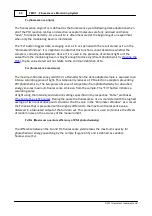
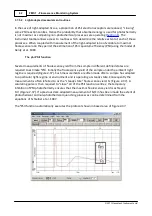
Fig. 2-35
. Fluorescence trace following measurement of Fv/Fm
Calculation of the rate constants for competing energy dissipation pathways in tissue under dark-
adapted (Fo) and light-saturated (Fm) conditions have shown that the ratio of variable to maximal
fluorescence (Fv/Fm) is directly proportional to the quantum efficiency of PSII photochemistry
(Butler 1977, 1978). Close correlation with other measures of quantum efficiency of
photochemistry in a wide range of species (Björkman and Demmig 1987) has resulted in
widespread use of Fv/Fm as a screening parameter for stress response.
The “Fv/Fm” button initiates a routine to measure Fo, Fm and calculate Fv, Fv/Fm. The routine
operates in three stages:
1. The modulation beam only signal is averaged for 1.6 sec to determine Fo,
2. A saturation pulse is applied to determine Fm (Figure 2-35),
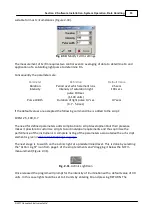
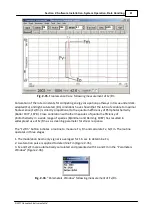
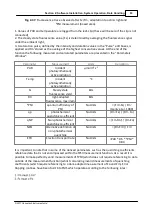
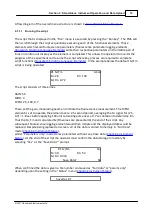
3. Fv and Fv/Fm are automatically calculated and presented with Fo and Fm in the “Parameters
Window” (Figure 2-36).
Fig. 2-36
. “Parameters Window” following measurement of Fv/Fm
Содержание FMS1
Страница 1: ......
Страница 7: ...Section 1 Measurement Principles and Hardware ...
Страница 21: ...Section 2 Software Installation System Operation Data Handling ...
Страница 70: ...70 FMS 1 Fluorescence Monitoring System 2017 Hansatech Instruments Ltd ...
Страница 71: ...Section 3 Stand Alone Instrument Operation and Data Upload ...
Страница 83: ...83 Section 3 Stand Alone Instrument Operation and Data Upload 2017 Hansatech Instruments Ltd ...
Страница 84: ...84 FMS 1 Fluorescence Monitoring System 2017 Hansatech Instruments Ltd 4 3 Local Mode Menu Structure ...

