36
FMS 1 - Fluorescence Monitoring System
© 2017 Hansatech Instruments Ltd
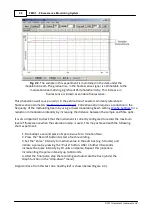
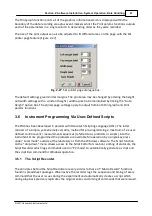
The on-screen ranges for both axes are set by entering “Start” and “End” points for each data
range on the appropriate axis “edit” boxes, allowing a user-defined degree of trace zoom. Other
display attributes include control over the background grid and whether data is plotted as
individual data points or a solid trace chart-emulation.
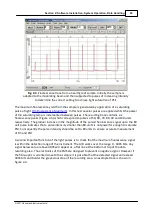
THE SHORT DURATION OF PULSES MEANS THAT THERE ARE A RELATIVELY
SMALL NUMBER OF PLOTTED DATA POINTS DURING EACH PULSE. WHEN
INDIVIDUAL DATA POINTS ARE PLOTTED IT MAY BE DIFFICULT TO VISUALISE
THE PULSE WITHOUT ZOOMING THE TRACE.
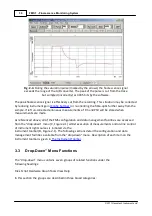
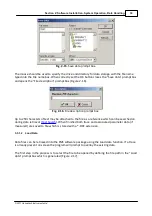
The individual data points which make up the recording may be accessed from the Tools menu.
3.4
Tools
The Tools menu contains items which relate to the raw data output from the A/D converter.
Tools
Tabulate
Event marker colour
3.4.1
Tabulate
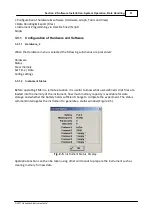
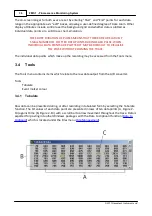
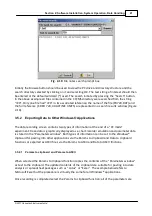
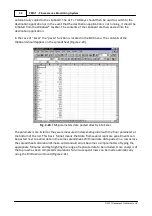
Raw data can be presented during, or after recording in tabulated form by selecting the Tabulate
function. The bit values of each data point are presented in rows of ten data points (A, Figure 2-
13) against time (B, Figure 2-13) with a scroll bar to allow movement throughout the trace. Data is
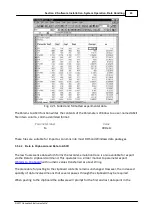
exported for pasting into other Windows packages with the Data to clipboard function (
) which is located under the Files menu (
).
Содержание FMS1
Страница 1: ......
Страница 7: ...Section 1 Measurement Principles and Hardware ...
Страница 21: ...Section 2 Software Installation System Operation Data Handling ...
Страница 70: ...70 FMS 1 Fluorescence Monitoring System 2017 Hansatech Instruments Ltd ...
Страница 71: ...Section 3 Stand Alone Instrument Operation and Data Upload ...
Страница 83: ...83 Section 3 Stand Alone Instrument Operation and Data Upload 2017 Hansatech Instruments Ltd ...
Страница 84: ...84 FMS 1 Fluorescence Monitoring System 2017 Hansatech Instruments Ltd 4 3 Local Mode Menu Structure ...

