


8
Subject to change without notice
Type of signal voltage
With the
HM303-6
, most repetitive signals in the frequency
range up to
at least 35MHz
(-3dB) can be examined.
Sinewave signals of
50MHz
are displayed with a height of
approx. 50% (-6dB). However when examining square or pulse
type waveforms, attention must be paid to the
harmonic
content
of such signals. The repetition frequency (fundamen-
tal frequency) of the signal must therefore be significantly
smaller than the upper limit frequency of the vertical amplifier.
Displaying composite signals can be difficult, especially if they
contain no repetitive higher amplitude content which can be
used for triggering. This is the case with bursts, for instance. To
obtain a well-triggered display in this case, the assistance of the
variable holdoff
and/or
variable time control
may be required.
Television
video signals
are relatively easy to trigger using the
built-in
TV-Sync-Separator (TV).
For optional operation as a
DC or AC voltage amplifier, the vertical amplifier input is
provided with a
DC/AC
switch. The
DC
position should only be
used with a series-connected attenuator probe or at very low
frequencies or if the measurement of the DC voltage content
of the signal is absolutely necessary.
When displaying very low frequency pulses, the flat tops may be
sloping with
AC
coupling of the vertical amplifier (
AC
limit
frequency approx. 1.6 Hz for 3dB). In this case,
DC
operation is
preferred, provided the signal voltage is not superimposed on a
too high DC level. Otherwise a capacitor of adequate capacitance
must be connected to the input of the vertical amplifier with DC
coupling. This capacitor must have a sufficiently high breakdown
voltage rating.
DC
coupling is also recommended for the display
of logic and pulse signals, especially if the pulse duty factor
changes constantly. Otherwise the display will move upwards or
downwards at each change. Pure direct voltages can only be
measured with
DC
-coupling.
Amplitude Measurements
In general electrical engineering, alternating voltage data
normally refers to effective values (rms = root-mean-square
value). However, for signal magnitudes and voltage designations
in oscilloscope measurements, the peak-to-peak voltage (Vpp)
value is applied. The latter corresponds to the real potential
difference between the most positive and most negative
points of a signal waveform.
If a sinusoidal waveform, displayed on the oscilloscope screen,
is to be converted into an effective (rms) value, the resulting
peak-to-peak value must be divided by 2x
√
2 = 2.83. Conversely,
it should be observed that sinusoidal voltages indicated in Vrms
(Veff) have 2.83 times the potential difference in V
pp
. The
relationship between the different voltage magnitudes can be
seen from the following figure.
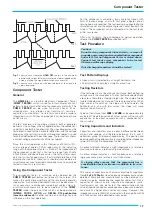
Voltage values of a sine curve
Vrms = effective value; Vp= simple peak or crest value;
Vpp = peak-to-peak value; Vmom = momentary value.
The minimum signal voltage which must be applied to the Y
input for a trace of 1div. height is
1mVpp
when the
Y-MAG. x5
pushbutton is depressed, the
VOLTS/DIV
. switch is set to
5mV/div., and the vernier is set to
CAL
by turning the
fine
adjustment knob
of the
VOLTS/DIV.
switch fully clockwise.
However, smaller signals than this may also be displayed. The
deflection coefficients
on the input attenuators are indicated
in
mV/div.
or
V/div.
(peak-to-peak value).
The magnitude of the applied voltage is ascertained by
multiplying the selected deflection coefficient by the vertical
display height in div.
If an attenuator probe x10 is used, a further multiplication by a
factor of 10 is required to ascertain the correct voltage value.
For exact amplitude measurements, the variable control on the
attenuator switch must be set to its calibrated detent
CAL.
When turning the variable control ccw, the sensitivity will be
reduced by a factor of 2.5.
Therefore every intermediate value is possible within the 1-2-
5 sequence.
With direct connection to the vertical input, signals
up to
400Vpp
may be displayed (attenuator set to
20V/div.
, variable
control to left stop).
With the designations
H
=
display height in div.
,
U
=
signal voltage in Vpp
at the vertical input,
D
=
deflection coefficient in V/div.
at attenuator switch,
the required value can be calculated from the two given
quantities:
However, these three values are not freely selectable. They
have to be within the following limits (trigger threshold, accuracy
of reading):
H
between 0.5 and 8div., if possible 3.2 to 8div.,
U
between 0.5mVpp and 160Vpp,
D
between 1mV/div. and 20V/div. in 1-2-5 sequence.
Examples:
Set deflection coefficient D = 50mV/div. 0.05V/div.,
observed display height H = 4.6div.,
required voltage U = 0.05·4.6 = 0.23Vpp.
Input voltage U = 5Vpp,
set deflection coefficient D = 1V/div.,
required display height H = 5:1 = 5div.
Signal voltage U = 230Vrms·2
√
2 = 651Vpp
(voltage > 160Vpp, with probe 10:1: U = 65.1Vpp),
desired display height H = min. 3.2div., max. 8div.,
max. deflection coefficient D = 65.1:3.2 = 20.3V/div.,
min. deflection coefficient D = 65.1:8 = 8.1V/div.,
adjusted deflection coefficient D = 10V/div.
The input voltage must not exceed 400V, independent
from the polarity.
If an AC voltage which is superimposed on
a DC voltage is applied, the maximum peak value of both
voltages must not or –400V. So for AC voltages with
a mean value of zero volt the maximum peak to peak value
is 800Vpp. If attenuator probes with higher limits are used,
the probes limits are valid only if the oscilloscope is set to DC
input coupling.
Type of signal voltage
Содержание HM303-6
Страница 1: ...O s c i l l o s c o p e H M 3 0 3 6 Manual English...
Страница 23: ...M A N U A L H A N D B U C H M A N U E L...


