64
System health, alarm status, and events are dis-
cussed in detail in Section 9. The Reduced Let-
Through button indicates if this mode is enabled
by changing color. A detailed discussion of this
mode is included in Section 4.
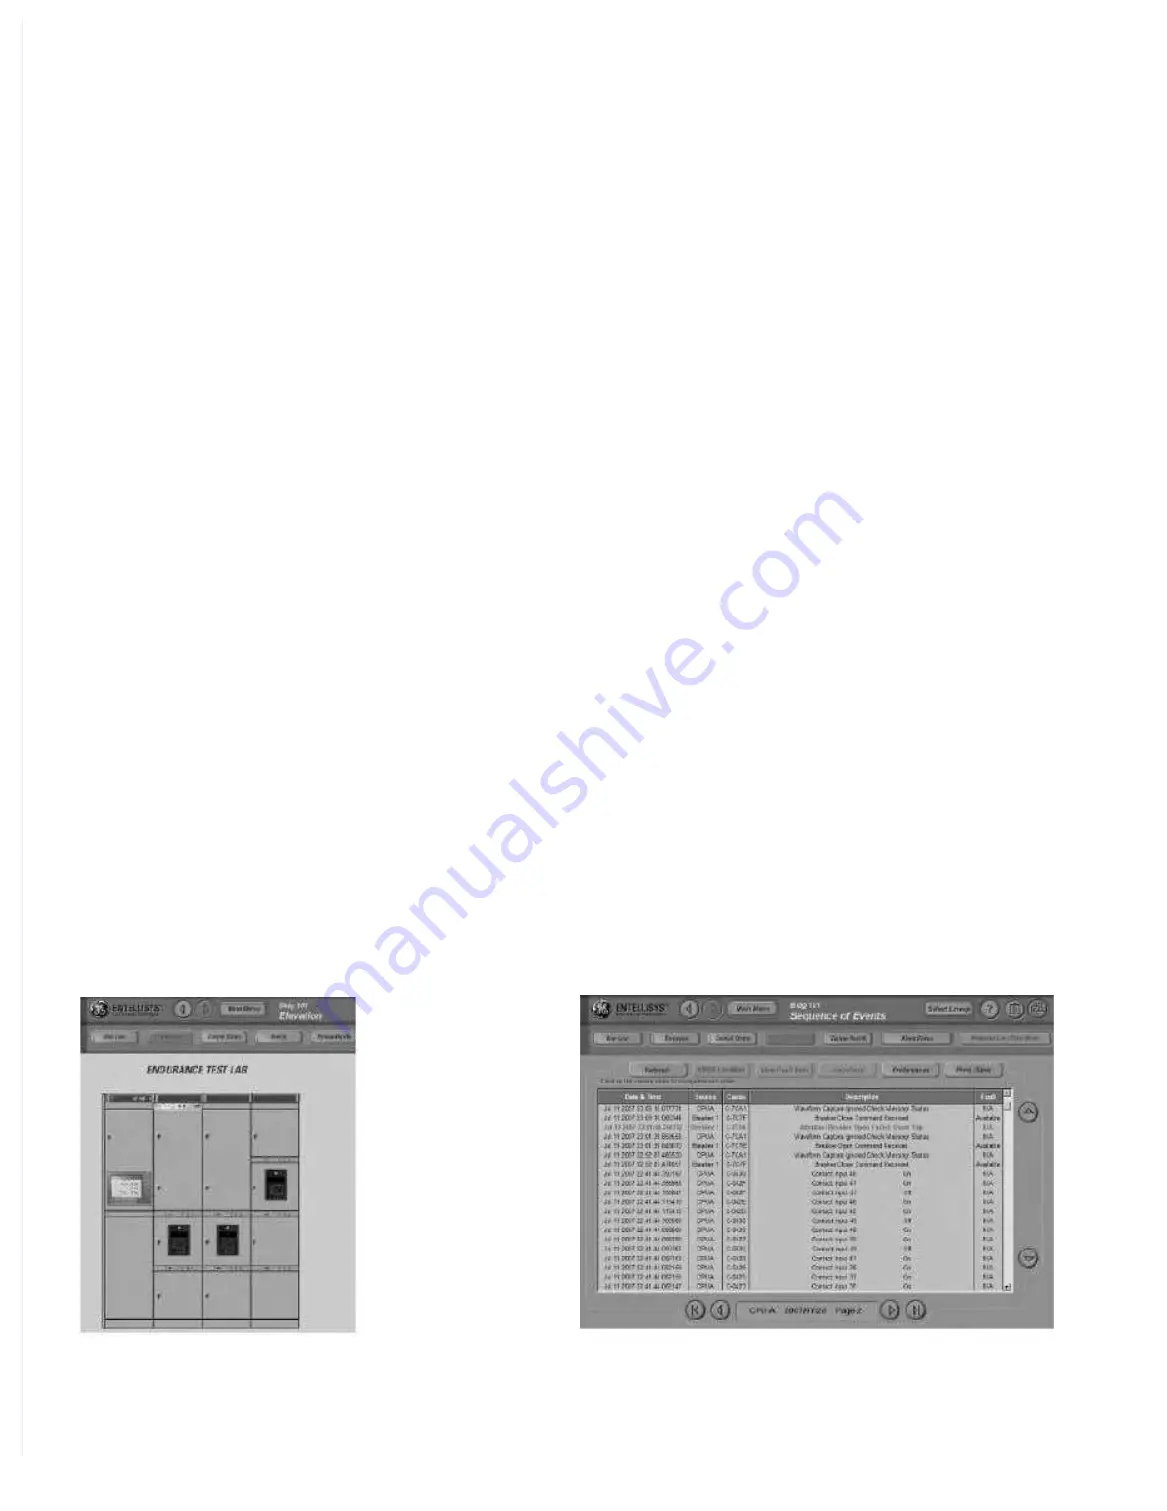
The Events button opens the Sequence of Events
log, as shown in Figure 13.9. The Entellisys system
can capture many different types of events, pro-
viding a valuable trouble-shooting tool. A complete
discussion of the Sequence of Events log is contained
in Section 9. The on-site system administrator can
filter the events to suit the needs of your site. This
filter is accessed by pressing the Preferences button
on the Events screen. The Events log provides
detailed information regarding the lineup dynamics.
The times at which circuit breakers go in and out
of pickup, system electronics health, and manual
occurrences, such as when people log into the
system, can be logged. It should be noted that the
Events log can capture open and close commands
issued through either the HMI or remote software.
The Events log also captures when a breaker is
commanded to trip by the button located on the
circuit breaker escutcheon. Consequently, the Events
log provides the ability to track what actually initiated
a breaker opening.
Each screen shows the events for a particular day,
with scrolling provided by the arrow buttons on the
right side of the screen. You can scroll to different
days using the arrow buttons at the bottom of the
screen. You can sort events by touching the column
title (date and time, source, etc.), making it easy to
group or find particular events. The far-right column,
titled Fault, indicates whether fault data and/or
waveform data are available for the particular event.
Fault data and waveforms are accessed by touch-
ing the particular event to highlight it and then
pressing the View Fault Data or Waveform buttons
at the top of the log. A complete discussion of
waveform capture capabilities plus examples are
provided in Section 9.
From any screen you can press the Main Menu
button to select any of the above mentioned
screens as well as those that do not have a ‘short-
cut’ button. For example, from the Main Menu drop
down you can select User Settings. Again, only
operators with permission to access User Settings
will see this button on the Main Menu. Figure 13.10
shows the User Settings screen, which displays
the various settings that are available.
For instance, the Overcurrent Protection button
displays the screen shown in Figure 13.11. This
provides a summary of the overcurrent protection
enabled for the circuit selected in the top-left corner.
There are individual screens for short-time, long-
Section 13. User Interface – HMI
Figure 13.8
Elevation Display
Figure 13.9
Sequence of Events Log
Содержание Entellisys 4.0
Страница 4: ...2 Notes ...
Страница 6: ...4 Notes ...
Страница 8: ...10 Notes ...
Страница 38: ...108 Notes ...
Страница 39: ...109 Entellisys Low Voltage Switchgear Appendix D Time Current Curves ...
Страница 40: ...110 Appendix D Time Current Curves ...
Страница 41: ...111 Appendix D Time Current Curves ...
Страница 42: ...112 Notes ...


