Action
Step
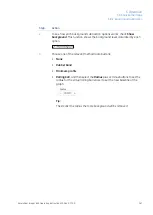
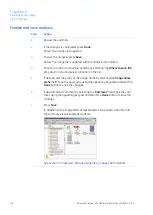
Select the fitting function by marking one of the Curve type radio buttons:
4
•
Linear - log - which presents a linear fit to logarithmic data.
•
Cubic spline - which presents a smooth polynomial that is piecewise
defined.
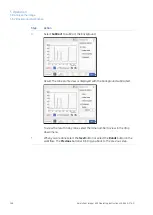
Select View plot to see the plot.
5
Select Close to return to the previous view.
6
When you are done select the Next button or select the Normalization
button in the workflow. The Previous button will bring you back to the previ-
ous step.
7
The calculated molecular weight is presented in the summarized table in Summary.
Note:
Add a molecular weight standard
marker
Action
Step
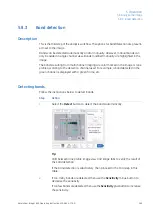
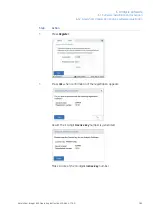
Select the Add new... button.
1
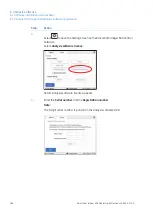
Result: The following view appears.
Select the Name field and type the name of the marker.
2
Select the unit from the Unit drop down menu.
3
Type a value, and select the Add button.
4
Result: The value will appear in the bottom of the list to the left on the screen.
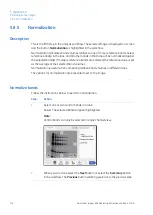
Select the Save button to save the added values and to return to the MW
Calibration view. Select Cancel to leave without saving changes.
5
172
Amersham Imager 600 Operating Instructions 29-0645-17 AD
5 Operation
5.8 Analyze the image
5.8.4 Molecular weight assignment


