


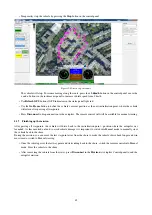
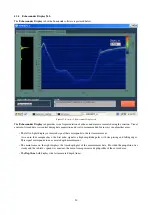

• Press the
Depth recording
button to start storing depth measurement data.
• Press the
Play
button to start real-time visualisation of the side-scan-sonar data.
• Press the
Record
button to start saving side-scan-sonar data.
• Monitor the visualisation of the measurement data on the map view.
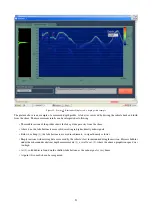
• Un-press
Depth recording
and/or
Recording
buttons to stop recording corresponding data.
You can repeat the steps above to record several sets of measurement data into a project-file:
• Press the
Save
button to save the recorded measurement data into a project.
Please refer to the supplied manufacturer’s guide for detailed software description and operating instructions!
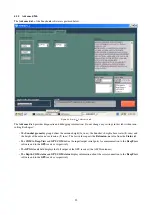
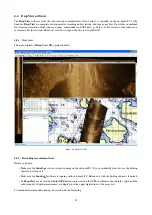
4.4.3
Processing measurement data
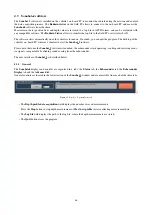
• Tools:
–
Use the
Pan
tool to pan the map view.
–
Measure distances on the map with the
Measure distance
tool.
–
Export the data to Google Earch with the
Google Earth
tool (internet connection is required).
–
Click on the data to display the vehicle’s route.
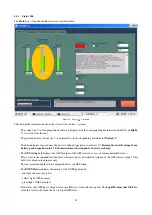
• 3D visualisation of the survey area:
–
In the Map View, select the area to be visualised with the
Select area
tool.
–
Right-click on the selected area and choose
3D
from the pop-out menu.
–
A 3D image will appear, rotate and scale it to your preference.
–
Right-click on the image and choose
Report
to save the current view to an image file.
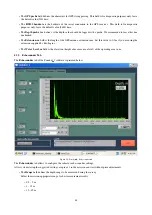
• Save selected area to an image file with the
Report
tool:
–
In the Map View, select the area to be visualised with the
Select area
tool.
–
Right-click on the selected area and choose
Report
from the pop-out menu.
–
Adjust report settings:
select image
Size
,
Transparent
background or a
Background
color, opt to
Draw Frame
with coordinates,
the background
Grid
and the
Grid Color
.
• Save measurement data into another folder
54


