User Manual
7 Logged Data Files
The measurement data file is formatted as a comma separated values file (.csv), allowing for easy
importing into spreadsheet or plotting software.
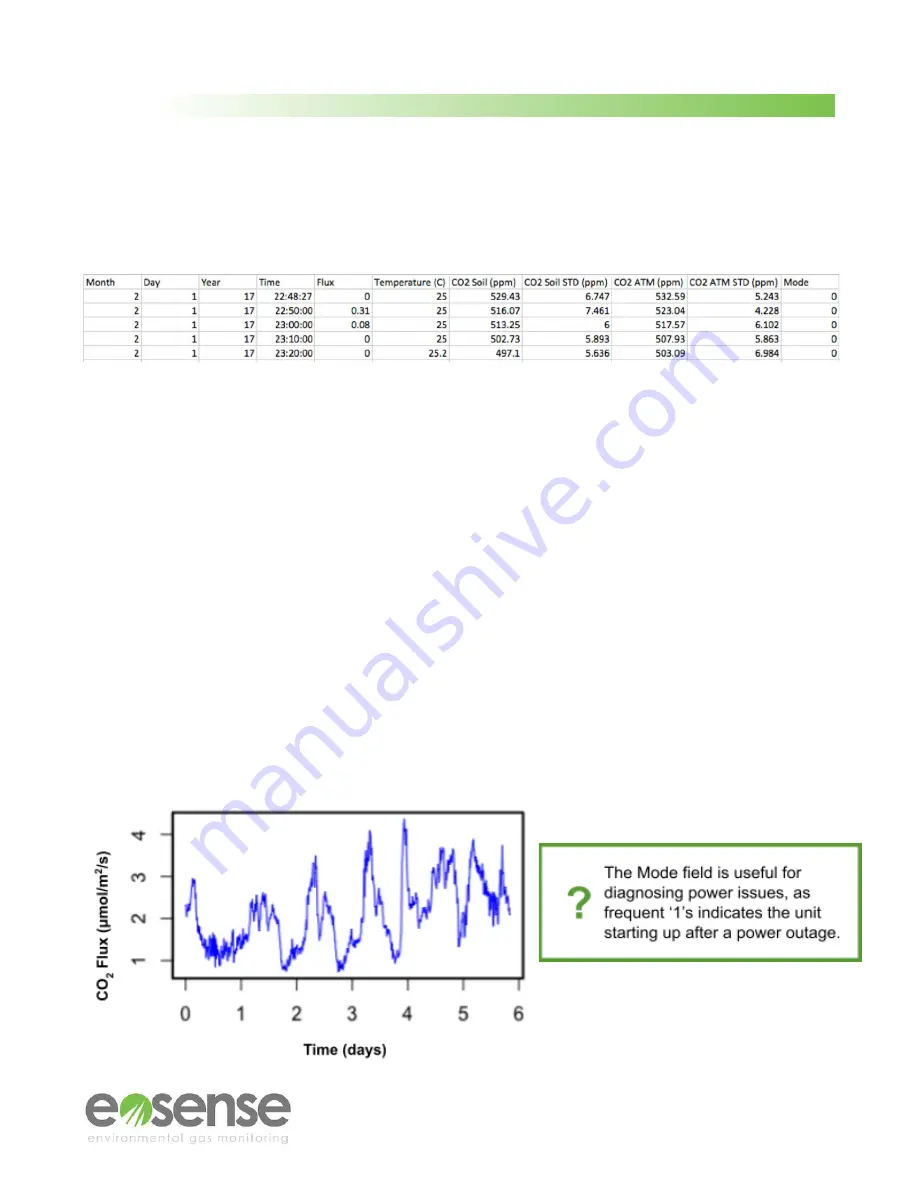
Figure 26
Example eosFD data, viewed as a spreadsheet
Month
The month in which the measurement was collected.
Day
The day of the month in which the measurement was collected.
Year
The year in which the measurement was collected.
Time
The time at which the measurement occurred (24 hour clock).
Flux
The estimated CO
2
flux rate from the soil surface in μmol m−2s−1.
Temperature
The approximate internal temperature of the eosFD in ◦C.
CO2_Soil
The soil surface CO
2
signal in ppm, only used for flux calculation.
CO2_Soil_STD
The standard deviation of the soil surface concentration of CO2 in ppm.
CO2_ATM
The atmospheric CO
2
signal in ppm, only used for flux calculation.
CO2_ATM_STD
The standard deviation of the atmospheric concentration of CO2 in ppm.
Mode
A status indicator showing when events occur (e.g. power outages):
0: Normal measurement data
1: Unit startup / power cycle
2: eosLink-FD connection detected
10-19: Unit startup with error code (contact Eosense Support)
Soil & ATM
VR/VA
Four columns of raw voltages for troubleshooting purposes.
Example flux data showing diurnal variation:
24
m
© Eosense Inc.


