DST ObservAir Скачать руководство пользователя страница 17


32 

ObservAir

 Operating Manual 


1.


Determine  BC

avg

  and  logging  interval

:  Both  of  these  parameters 

depend on the sensor application and must be determined by the user. 
The  average  BC  concentration  (BC

avg

)  during  the  campaign  can  be  

estimated  by  (1)  searching  the  literature  or  regulatory  databases  for 
representative  BC  concentration  data,  or  (2)  conducting  preliminary 
testing with the ObservAir at a flow rate setting of 100 ccm.


The logging 

interval is dictated by the application context and goals. For example, 
long-term ambient monitoring may only require hourly measurements, 
while mobile platforms require rapid data logging every 10 seconds or 
less. In both cases, these parameters may simply be estimated to set 
the sensor flow rate initially, and adjusted thereafter depending on the 
results. As an example, we will choose values of 0.4 ug/m

3

 and 1 hour 

to illustrate each step in this procedure.  

2.


Calculate requisite BC measurement resolution: 

As a rule of thumb, 

the baseline noise at the desired logging  interval should be < 10% of 
the  expected  BC  concentration.  So  for  our  example,  baseline  noise 
should be < 0.1*0.4 = 0.04 

µ

g/m

on an hourly basis.  

3.


Calculate the minimum allowable flow rate: 

From Table 4, find the BC 

baseline noise at the requisite timebase (2 sec, 15 sec, 1 min, or 1 hour). 
Since this noise specification is for a flow rate setting of 100 ccm, the 
minimum  required  flow  rate  can  be  estimated  using  the  equation 
below. For our example, Table 4 shows that the baseline BC noise at 1 
hour is 0.01 

µ

g/m

3

, so the minimum flow rate is (0.01/0.04)*100 = 25 

ccm.  Note  that  the  results  of  this  calculation  are  bounded  by  the 
ObservAir’s  minimum  and  maximum  flow  rate  settings:  25  and  200 
ccm respectively.  

𝐹𝑅

.%/

𝑁𝑜𝑖𝑠𝑒

$0"1

𝑁𝑜𝑖𝑠𝑒

!"2

× 100ccm         (6)


FR

min

 = Minimum allowable flow rate (ccm) 


Noise

spec

 = Baseline specification from Table 3 (

µ

g/m

3


Noise

req

 = Maximum BC noise calculated in Step 2 (

µ

g/m

3


4.


Calculate the maximum filter life: 

Using the average BC concentration 

from Step 1 and minimum flow rate setting from Step 3, calculate the 
filter  life  according  to  the  equation  provided  in  Section  4.1.  In  our 
example, the maximum filter life is 313.5/(25*0.4) = ~31 days.  

5.


Optimize the flow rate to meet your needs:

 Given these limiting values, 

the flow rate setting can be optimized to meet your needs. For example, 
if greater BC measurement resolution is desired at the expense of filter 
life, the flow rate can be increased past the minimum value. Conversely, 
flow rate may be reduced to achieve the opposite result.   


33 

ObservAir

®

 Operating Manual 


For  reference,  Table  7  shows  the  ObservAir’s  minimum  flow  rate 

setting and maximum filter life as a function of average BC concentration 
and data logging period. The values in the table are calculated according 
the procedure presented above. Two illustrative scenarios are also provided.  
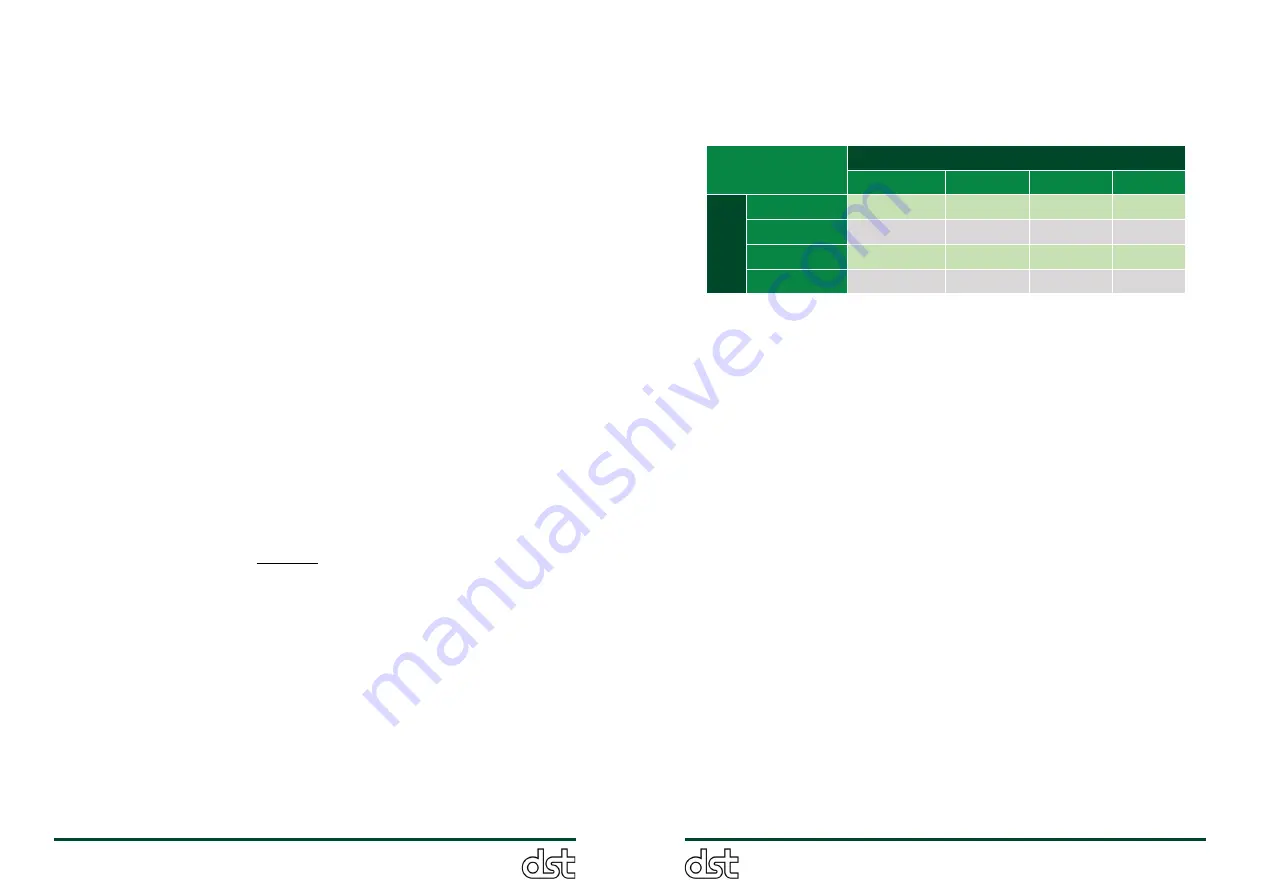


Data logging period 

2 sec 

15 sec 

1 min 

1 hour 

Av

g

BC


0.5 

µ

g/m

3


N/A 

200/3.1 

100/6.3 

25/25.0 

µ

g/m

3


200*/1.6ª 

100/3.1 

50/6.3 

25/12.5 

µ

g/m

3


60/1.0 

25/2.5 

25/2.5 

25/2.5 

10 

µ

g/m

3


30/1.0 

25/1.3 

25/1.3 

25/1.3 

Minimum Flow Rate (ccm)*/ Maximum filter life (days)ª   


Table 8. 

ObservAir’s minimum flow rate setting and maximum filter life as 

a function of average BC concentration and data logging period. The 

ObservAir cannot provide BC concentration data with a baseline noise < 

0.05 

µ

g/m

3

 on 2-second basis, so the top left cell is empty. 


Scenario 1:

 BC

avg 

= 7 ug/m

3

, Logging interval = 2 seconds  

For this scenario, the BC baseline noise should be 

 0.7 

µ

g/m

3

 at 2-second 

logging.  Using  the  calculation  procedure  above,  the  minimum  flow  rate 
setting is (0.3/0.7)*100 = 43 ccm. For these settings, the maximum filter 
life  is  ~1  day.  Alternatively,  refer  to  Table  8  and  see  that  for  2-second 
measurements of 5 

µ

g/m

3

 average concentrations, the flow rate setting is 

60 ccm. By interpolation, the flow rate can be set to 60*7/5 = 43 ccm.  


Scenario 2:

 BC

avg 

= 0.35 ug/m

3

, Logging interval  = 1 minute  

The BC baseline noise should be from 

 0.035 

µ

g/m

3

 at 1-minute logging. 

From  Table  1,  the  noise  is  0.05  ug/m

at  1-minute  and  100  ccm,  so  the 

minimum flow rate is (0.035/0.05)*100 = 70 ccm. In Table 8, a flow rate 
of 100 ccm is recommended for 1-minute measurements at 5 

µ

g/m

3

. By 

interpolation, the flow rate can be set to 100*0.35/0.5 = 70 ccm. The filter 
life can be calculated as 313.5/(0.35*70) = 12.8 days.  
 

IMPORTANT  NOTE:   

The  above  considerations  do  NOT  apply  to  gas 

sensing.  The  gas  sensors’  measurement  performance  remains  largely 
constant with flow rate. Only the gas sensors’ time response is affected by 
flow rate, simply because of the residence time of sample air through the 
sensor’s closed volume naturally varies. At higher flow rates, the residence 
time diminishes and the gas cells respond more rapidly.  

Содержание ObservAir

Страница 1: ...rational limits and warnings 11 3 Operating Instructions 13 3 1 Hardware overview 13 3 2 Interactive LED button Sensor display and control 14 3 2 1 Sensor startup 15 3 2 2 Default LED mode Pollutant c...

Страница 2: ...pport WiFi and USB communication protocols and include a 16GB removable SD card for onboard data storage Units may also be supplemented with an LTE LoRa or SigFox communication module and a GPS unit f...

Страница 3: ...collection area is 3 mm in diameter After the first filter the air flow passes through a second reference filter assembly that is identical to the first Since the air is filtered devoid of PM the int...

Страница 4: ...plication Operate the 7 ObservAir Operating Manual ObservAir for 12 to 24 hours in an environment that is free of the analyte gas es and average the voltage differential data collected over the entire...

Страница 5: ...technical specifications are summarized in the tables below All electrochemical cells are sourced from Spec Sensors Gas measurement performance specifications are adapted from data provided by the ma...

Страница 6: ...intervals 2 3 Operational limits and warnings Environmental limits Only operate the ObservAir within the conditions listed in Table 1 Temperature and relative humidity must remain between 5 to 40 C an...

Страница 7: ...nd may result in permanent damage to the unit and or harm to the user Please contact DST Technical Support at info dstech io regarding any problems with your unit that cannot be resolved with the inst...

Страница 8: ...llutants For every new start up event a new data file is created on the SD card txt file and is assigned a filename that contains the sensor s ID number and the start up time date Section 3 5 1 3 2 2...

Страница 9: ...f the ObservAir hold the LED button to cycle through the menu until the first red flash and release The sensor will flash red two more times to confirm that it is shutting down 3 2 6 Sensor alarms and...

Страница 10: ...ront panel 19 ObservAir Operating Manual 3 5 Data collection from onboard SD card While the ObservAir is operating data is written to the onboard SD card in real time as both a primary means of data c...

Страница 11: ...e ADC s raw count Full scale value is 8388607 d ATN Optical attenuation unitless e BC Black carbon in g m3 f T Temperature in C g RH Relative humidity in h FR Sample flow rate in ccm i VBAT Battery vo...

Страница 12: ...tings Figure 12 6 With the Serial Monitor configured ObservAir data is displayed in real time at the time interval set by the user Commands can also be sent to the sensor using the dialog box at the t...

Страница 13: ...8 to 1 2 Set flow rate calibration coefficient Table 7 ObservAir serial commands and descriptions 25 ObservAir Operating Manual 3 7 WiFi connection Provisioning WiFi credentials to the ObservAir allo...

Страница 14: ...1 Zero calibration of pollution sensors Each ObservAir comes with a zero calibration sheet but it is good practice to periodically verify the sensor s baseline performance especially before and after...

Страница 15: ...but clearly the calibration is only as good as the reference measurements collected 4 4 Leak check The ObservAir incorporates a monolithic design architecture that is more robust than traditional ins...

Страница 16: ...loading artifact is not static it depends on the emissions source e g biomass vs diesel atmospheric conditions seasonality and other factors Therefore filter loading correction algorithms should be c...

Страница 17: ...ing can be optimized to meet your needs For example if greater BC measurement resolution is desired at the expense of filter life the flow rate can be increased past the minimum value Conversely flow...

Страница 18: ...exhaust stacks vehicle tailpipes and other pollution sources When sampling emissions directly do not exceed the ObservAir s maximum temperature relative humidity range and pollution concentration rat...

Страница 19: ...If BC measurements are proportionally lower than the reference value then it is also possible but less likely that the ObservAir is leaking Given these potential error modes it is important to valida...

Страница 20: ...38 ObservAir Operating Manual Figure 14 Hard reset using the magnetic cover...

Отзывы: