


14
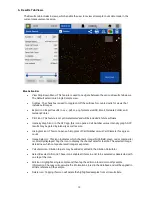
Single Sample Results View
•
Sample Number: The arrows on either side of the sample number are used to switch between
samples measured in the current session.
•
Sample Name: This is an editable field. Changes will overwrite the information stored in the
database and will be applied to all lists referencing the sample.
•
Results Panel: A table of results will be displayed in the Results panel. If dilution parameters were
provided at the time the count was initiated, then dilution guidance will also be presented in the
panel.
•
Gating Panel: A cell size gating bar is shown at the bottom of the left side of the screen. The size
gating may be changed for a given sample and the results shown in the Results Panel and image
will automatically update. The results can be saved by tapping the Apply and Save button.
•
Reprocess Panel: The Reprocess button enables the user to reanalyze the saved images. The
user may adjust a subset of protocol settings and then reprocess the image using the new set of
parameters. The reprocessed result overwrites the previous result. The raw images are
unaffected by reprocessing.
•
Next Count Button: The user may return from the result screen to the count screen and count the
active sample again. The user may adjust protocol settings, exposures, and focus and capture a
new image to count. The previous results will be overwritten. To capture a new result of a new
sample, raise the arm, clean the upper and lower sample surfaces, and lower the arm to load the
next sample.
Results List View
•
List: The list includes all samples counted in the current measurement session.
•
When the Show Dilution Guidance box is checked, the dilution guidance is displayed with each
result in the list for which dilution information was entered.
Image List View
•
List: The list includes all samples counted in the current measurement session.
•
Cell Count: The sample cell count is presented in the table. This value automatically updates
whenever the results are recalculated due to a change in cell size limits or other counting
parameters.
Graph View
•
Includes a summary of results to allow the user to select different charts to add.
•
A color legend is included for the various histograms. Select up to 5 samples at a time to chart.
•
Graph Type Menu: Use the drop down to select additional graph types.
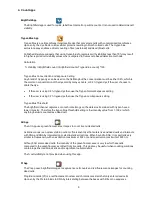
Graph Types
The graph types available are app dependent. Graphs may be expanded to full screen for easier viewing
using the expand/collapse button.
The types available to view:
With or without cell size distribution
•
Total Cell Count: Available for the Brightfield and GFP apps only.
•
Live Cell Count: Available for all apps except Brightfield.
•
Dead Cell Count: Available for Trypan Blue, PI, AO/PI and Yeast apps.
•
Live and Dead Cell Count: Available for Trypan Blue, PI, AO/PI and Yeast apps.
Содержание CellDrop
Страница 1: ...rev MAR 27 2019 ...


