C
HAPTER
1 A
CQUISITION
? L
OGGING
?…: Important Concepts
9
UM-0071-A0
In addition, the DT800 allows you to
• define your own linearization characteristics for any
unusual sensor that is not directly supported by the
DT800
• carry out statistical operations on the measurements,
only returning the statistical results you want
(average, standard deviation, maximum,
minimum,…)
• apply other calculations or expressions you define
to process the collected data.
Time and Date Stamps
Because you’ll often want to know the time and date
each measurement was made, the DT800
automatically keeps this information along with the
measurements. This facility ensures that every reading
from every sensor can be
time-stamped
and
date-
stamped
.
Data Format, Display and Storage
Your DT800 is extremely powerful and flexible in the
ways it allows you to format, view and store data.
Data Format
You can format (layout, arrange) the data provided by
your DT800 to best suit the way you want to use it,
and the DT800 has two modes for doing this: free-
format mode and fixed-format mode.
In
free-format mode
, you’re free to format the data
any way you want. For example, you can make it easy
and meaningful to read, like
or comma-separated ready for direct importing into a
software spreadsheet, like
or with the time of each reading included, like
In
fixed-format mode
, the DT800 returns data in a
predictable, repeatable, comprehensive format ready
to be imported into spreadsheets and other data
analysis software.
Real-time data can be returned in either free- or fixed-
format mode, but logged data is always returned in
fixed-format mode. These two modes are discussed in
“Format of Returned Data" in Part A of the
DT800
dataTaker User’s Manual.
Data Display
You can connect the DT800 to any computer and,
using appropriate software, data can be viewed on
the computer screen as it is acquired.
Data Storage
Data can be stored in the DT800’s own internal
memory, in a removable memory card, or you can
transfer it to a computer.
Once in the computer, you can save the data file for
later reference, or bring it into one of many
spreadsheet or plotting programs for analysis. For
example, you can use Microsoft
®
Excel to create a
printed report (including graphs), or
dataTaker’s
CONVERSION
BY DT800
DT800
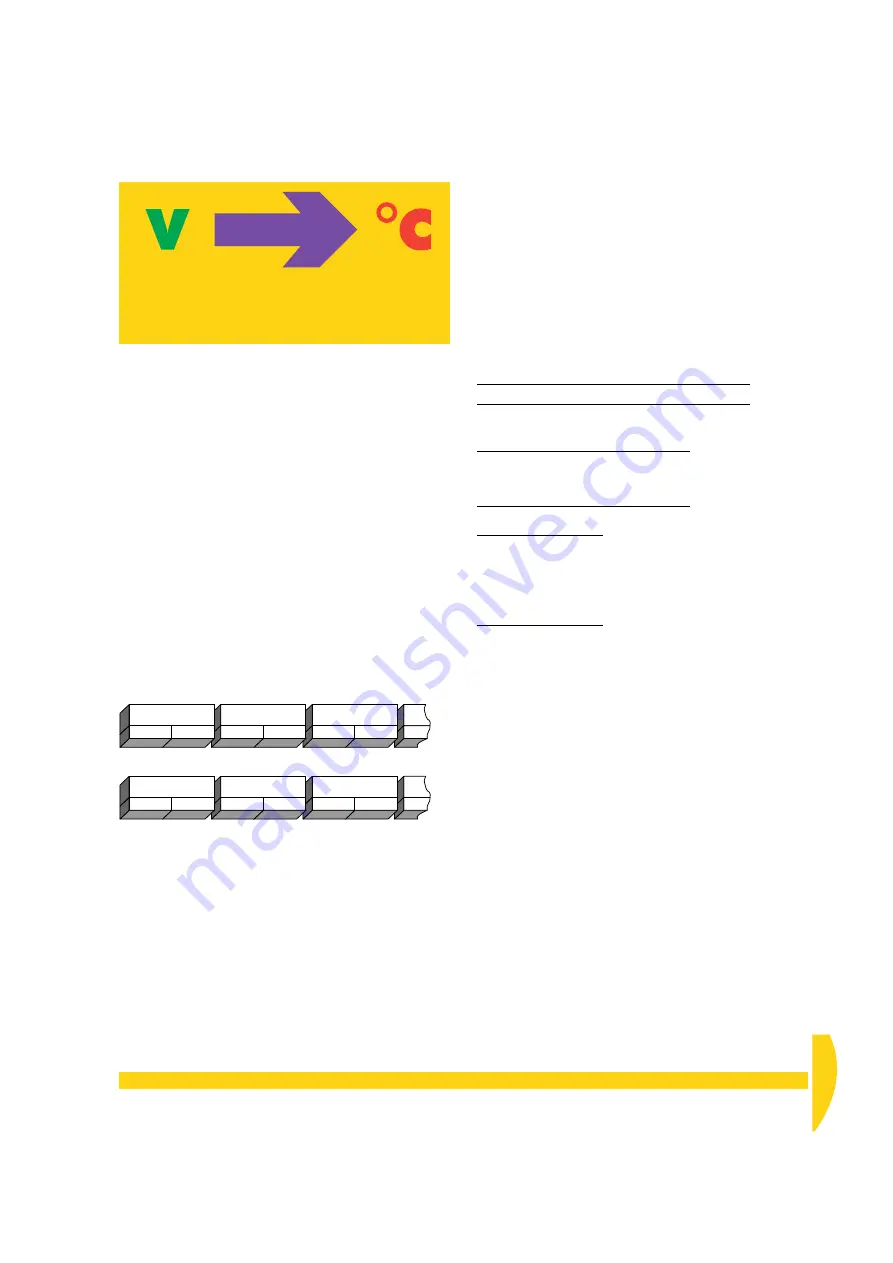
automatically performs
linearization
and
compensation
Raw
thermocouple
output
(volts)
Meaningful
quantity
(degrees
Centigrade)
F
IGURE
3
One of the DT800’s many automatic
conversion routines
Example
Me
Dat
Measurement 3
Date 3
Time 3
Measurement 2
Date 2
Time 2
Measurement 1
Date 1
Time 1
5/6
162.1
°
C
5/6/00 9:16:00
163.7
°
C
5/6/00 9:15:00
163.4
°
C
5/6/00 9:14:00
F
IGURE
4
Your DT800 produces a series of
information “chunks”.
Boiler temperature 123.4 Deg C
123.4,123.7,123.1,123.6
123.3,123.7,124.2,124.5
124.2,124.6,124.8,125.1
00:00:00,24.8
00:00:02,24.9
00:00:04,24.5
00:00:06,24.2
00:00:08,24.0
Содержание DT800
Страница 1: ...UM 0071 A0 ...
Страница 2: ...UM 0071 A0 ...
Страница 73: ...UM 0071 A0 ...
Страница 74: ...UM 0071 A0 ...


