AC-DC Converters Value-added type
Instruction Manual
SNDPF-9
SNDPF
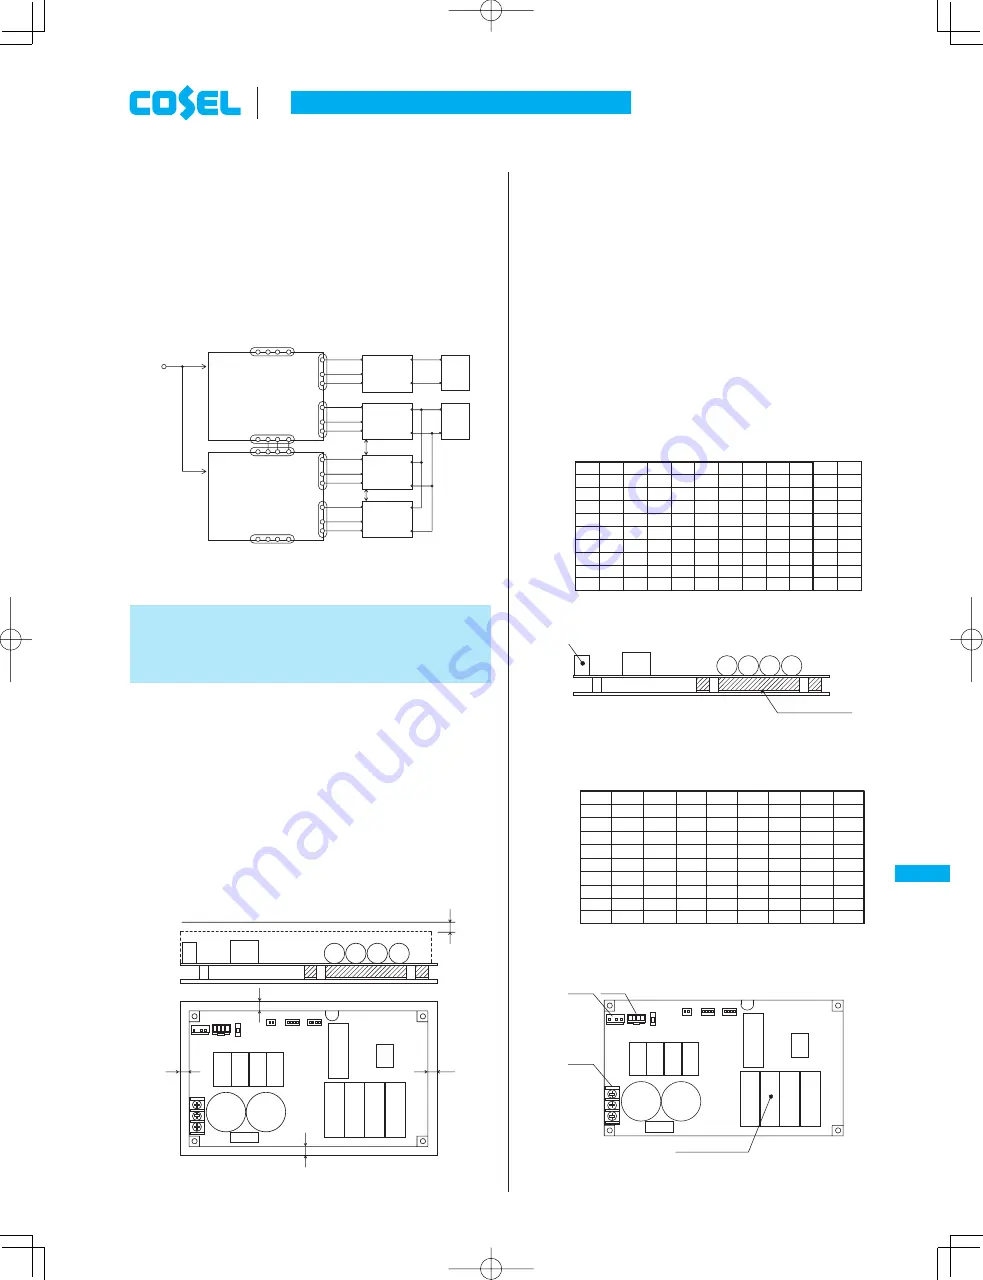
5.3 Synchronized start up of Several power supplies
¡
Make a connection in Figure 5.2, ENA signal to be synchronized,
even if you do not parallel operation is possible.
When all SNDPF1000 connected becomes able to work, ENA
signal turns into H .
When one of the SNDPF1000 connected is prohibited , ENA sig-
nal turns into L .
For parallel operation and shall not, eliminating the output side
diode, a fuse.
AC IN
+V
ENA
-V
+V
ENA
-V
+V
ENA
-V
+V
ENA
-V
SNDPF1000
CB
SG
C-AUX
C-ENA
SNDPF1000
CB
SG
C-AUX
C-ENA
CN5
CN6
CN5
CN6
Load
Load
Parallel operation
Parallel operation
SNDBS
SNDBS
SNDBS
SNDBS
Fig.5.2 Synchronized start up connection Example
6 Implementation
-
Mounting Method
6.1 Mounting method
¡
The unit can be mounted in any direction. When two or more
power supplies are used side by side, position them with proper
intervals to allow enough air ventilation. Aluminum base plate
temperature around each power supply should not exceed the
temperature range shown in derating curve.
¡
In case of metal chassis, keep the distance between d1 for to in-
sulate between lead of component and metal chassis.
If it is less than d1, insert the insulation sheet between power sup-
ply and metal chassis.
d1
d1
d1
d1
d1
d1=4mm min.
Fig.6.1 Mounting method
6.2 Derating
¡
Use with the conduction cooling (e.g. heat radiation by conduction
from the aluminum plate to the attached heat shink).
Fig.6.2 shows the derating curve based on the aluminum base
plate temperature.
¡
Please measure the temperature on the aluminum base plate
edge side (Point A).
Please consider the ventilation to keep the component tempera-
ture on the PCB (Point B) less than the temperature of Fig.6.3.
¡
It is necessary to note the thermal fatigue life by power cycle.
Please reduce the temperature fl uctuation range as much as pos-
sible when the up and down of the temperature are frequently
generated.
Contact us for more information on cooling methods.
20
40
60
80
100
0
0
20
40
60
80
100
90
Temperature of point A [
C
]
Load factor [%]
-20
TB1
Point A
Measuring Point
Fig.6.2 Derating curve of point A
Temperature of point B [
C
]
Load factor [%]
0
50
100
-20
-10
0
10
20
30
40
50
60
70
CN1
TB1
CN2
Point B (C55)
Measuring Point
Fig.6.3 Derating curve of point B
OG UPFRHKPFF


