4-15
User Guide for the Catalyst Express 500 Switches
OL-8122-01
Chapter 4 Monitoring
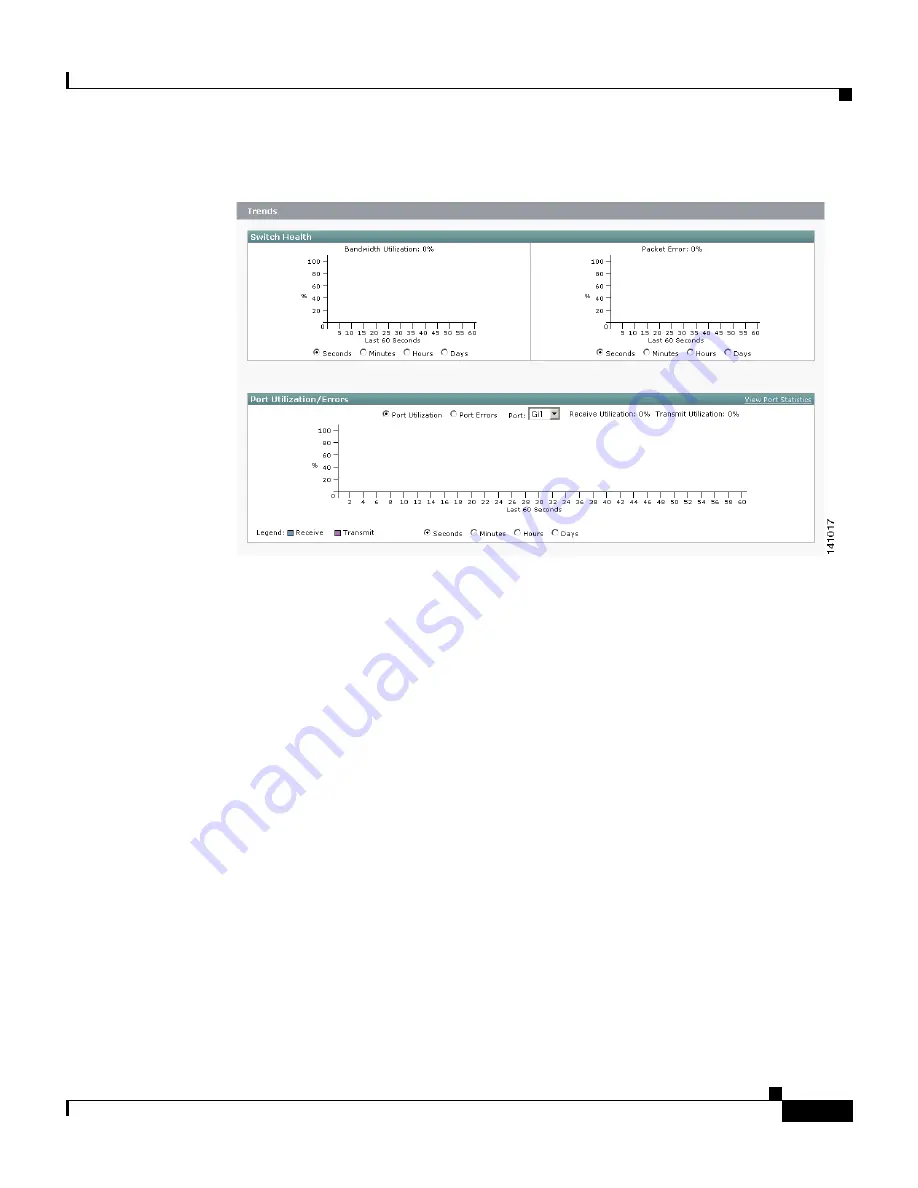
Check the Trends Graphs
Figure 4-5
Trends Window
Bandwidth Utilization Graph
The Bandwidth Utilization graph shows the same information as the Bandwidth
Used gauge on the Dashboard, except that the graph can show bandwidth usage
patterns over incremental instances in time (by 60 seconds, 60 minutes, 24 hours,
or 14 days). This graph also marks the highest peak reached. The default is 60
seconds.
If you see sharp increases in switch usage, use this graph to determine when
unusual peaks in network usage occur. For more information about bandwidth
usage, see the
“Bandwidth Used Gauge” section on page 4-10
.
Содержание 585-LRE - 585 LRE Customer Premise Equipment Bridge
Страница 4: ......
Страница 10: ...Contents x User Guide for the Catalyst Express 500 Switches OL 8122 01 ...
Страница 28: ...Chapter 1 Introduction When You Are Done 1 14 User Guide for the Catalyst Express 500 Switches OL 8122 01 ...
Страница 106: ...Chapter 5 Troubleshooting When You Are Done 5 12 User Guide for the Catalyst Express 500 Switches OL 8122 01 ...
Страница 114: ...Appendix A Reference Connector Specifications A 8 User Guide for the Catalyst Express 500 Switches OL 8122 01 ...
Страница 138: ...Index IN 14 User Guide for the Catalyst Express 500 Switches OL 8122 01 ...


