REVEX
2PH from 120A to 210A
User’s manual
47
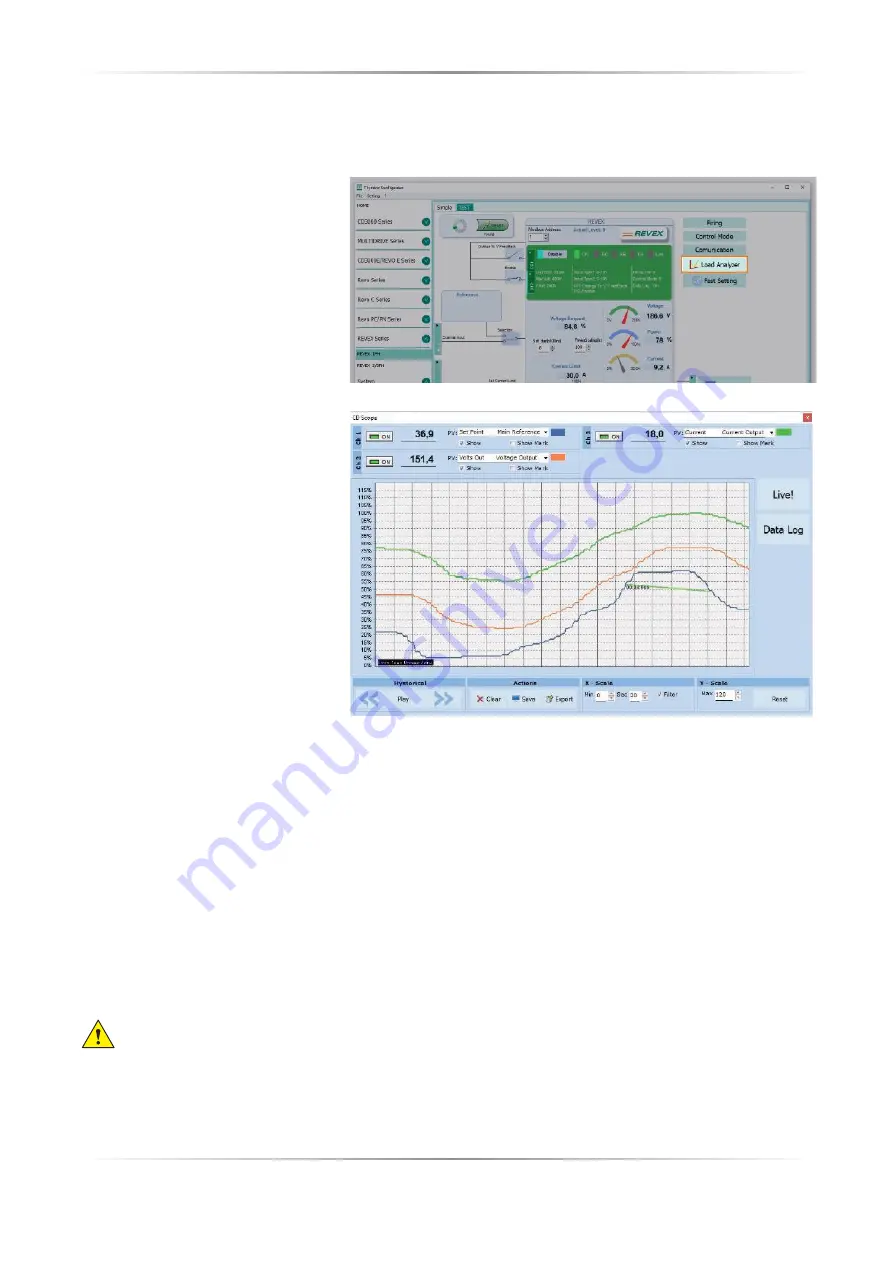
10.6.4. Load Analyzer
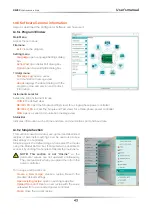
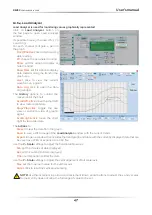
Load Analyzer is used for monitoring values graphically represented
Click on
Load Analyzer
button on
the test page to open Load Analyzer
window.
It’s possible to see 3 channels (Ch 1, Ch
2 and Ch 3).
For each channel confi gure a pen on
the graph:
On/Off button
: click to start trending
data reading
PV
: choose the parameter to trend
Show
: set this option to display or
hide the trend
Show Mark
: set this option to display
data markers along the trend in the
graph area
Live!
: click to view the current
waveform on a graph.
Data Log
: click to open the Data
Log window.
The
History
options to control the
movement of the chart:
Scroll left-click
: move the chart left
to view more recent data
Stop/Play-click
: toggle the live
view or Hystorical view of graphic
signal
Scroll right-click
: move the chart
right to view older data
The
Actions
to:
Clear
: to clear the data from the graph
Save
: to save a JPEG image of the
Load Analyzer
window with the current trends
Export
: to open a window that includes the trend graph and table with the currently displayed data that can
be saved as a JPEG or exported to a CSV fi le.
Use the
X – Scale
settings to adjust the horizontal (time) axis:
Min
: set the minutes of data displayed
Sec
: set the seconds of data displayed
Filter
: set this option to fi lter the data
Use the
Y – Scale
settings to adjust the vertical (percent of full scale) axis
Max
: set the maximum value for the vertical axis
Reset
: click to reset the vertical axis scaling
NOTE!
Use the increment (up arrow) and decrement (down arrow) buttons to adjust the x and y scales.
Numeric entry does not allow the full range of values to be set.


