


16
6. ANALYZING YOUR SESSION
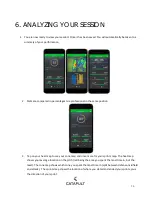
1.
You are now ready to view your session! Once it has been saved. You will automatically be taken to a
summary of your performance.
2.
Stats are compared in percentages to a professional in the same position.
3.
Tap on your heat map to see your zone map and once more for your sprints map. The heat map
shows your average location on the pitch (red being the area you spent the most time in, but the
least). The zone map shows which zone you spent the most time in (split between defense, midfield
and attack). The sprints map shows the location of where you stated and ended your sprints, plus
the direction of your sprint.


