4-41
VB Administration
T
ools
q
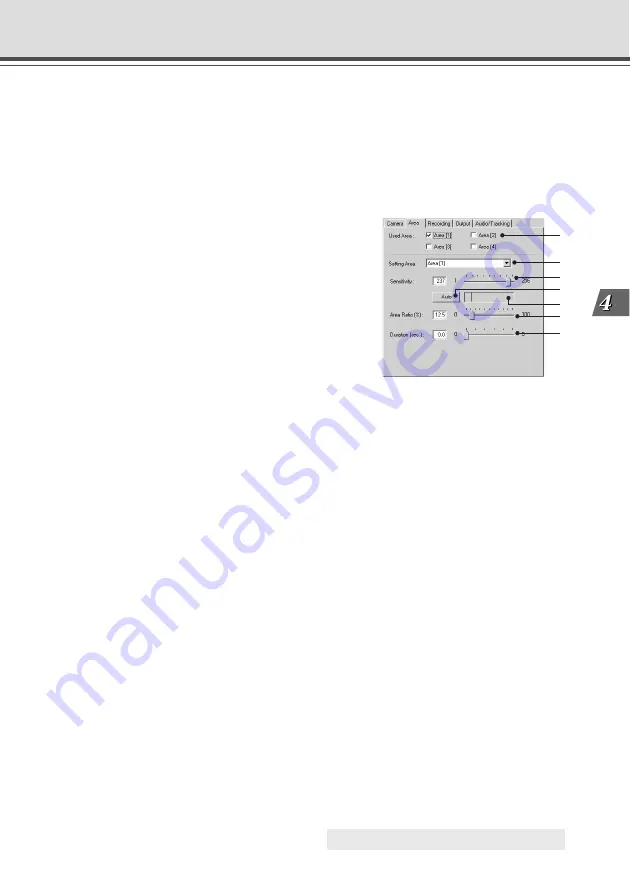
Used Area
Check the number of the motion detection area to be used
and the detection area frame is displayed in the Viewer.
You can create a maximum of 4 motion detection areas.
Schedule Setting Tool
3. Create a motion detection area (Area tab)
Create an area in the viewer within which motion detection is to be performed (motion
detection area). You can create a maximum of 4 motion detection areas, and reshape
and move each area frame by dragging the mouse. Change the shape by dragging the
black boxes on the 4 corners and sides of the frame, and move the frame by dragging the
inside of it with the mouse. Also, you can set a separate level of motion detection in each
area. See step 4 for how to set up the level of motion detection.
4. Setting the level of motion detection for the motion detection area (Area tab)
These settings determine how great the variation must be (sensitivity), how large the changed
area must be as a proportion of the whole detection area (area ratio), and how long the
variation must continue (duration) before it is recognized as motion and the specified action is
performed.
You can also set the level of motion detection for the device by checking in Video Mode the
image recorded with Live Mode (
→
P.4-47).
w
Setting Area
If you have created two or more motion detection areas, you can set separate levels of motion detection
in each area frame. In Setting Area, select a setting number.
e
Sensitivity
Select the sensitivity of the motion detection in a range of 1-256. Either enter the setting or set sensitivity
by dragging the slide bar. The larger the numeric value, the higher the degree of sensitivity will be.
r
“Auto” button
The “Auto” button sets sensitivity automatically. For several seconds after clicking the “Auto” button, the
VB-C50Fi assumes that there is no motion in the image in the motion detection area and, based on this
information, sets the camera at optimum sensitivity. Set when there is no motion.
t
Detection indicator
Displays the area ratio of motion detected by the device in real time in the form of a graph (
→
P.4-46).
○ ○ ○ ○ ○ ○ ○ ○ ○
Continued on the following page.
a
w
y
u
q
e
r
t


