2 1
Questions about Cala Trio? Visit CalaTrio.com/HCPFAQs
LBL-5122 Rev C NOV 2019
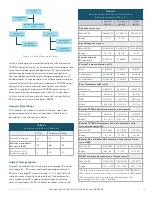
TABLE 8
Secondary Endpoint: Change in TETRAS Spiral ratings
during stimulation (EAP; N = 77)
N
Mean Change (95%CI)
Treatment
40
-0.37 ( -0.53 - -0.21)
Sham
37
-0.37 ( -0.54 - -0.20)
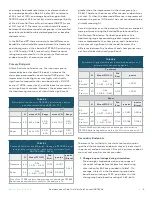
TABLE 9
Secondary Endpoint: Self-assessed improvement (CGI-I)
(EAP; N = 77)
Treatment 3
13
19
5
0
0
0
Sham
1
8
14
13
1
0
0
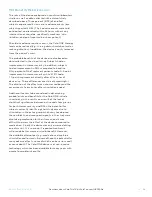
ratings corresponding to moderate tremor. During
stimulation, the spiral rating was 2.58 in the
treatment group and 2.26 in the sham group. During
stimulation, the treatment and sham groups improved
similarly by an estimated 0.37 points
(Table 8)
.
2. Clinical Global Impression-Improvement (CGI-I) Scale:
A greater percentage of subjects in the treatment
group
(88%, 35/40)
reported an improvement after
stimulation compared to the sham group
(62%,
23/37)
. No subjects in the treatment group reported
worsening, compared to 1 subject in the sham group.
More subjects with TAPS therapy felt they had
experienced an improvement in tremor than subjects
who received sham stimulation.
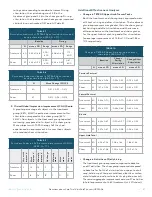
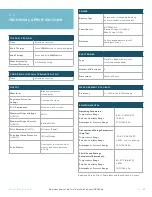
TABLE 10
Change in TETRAS Upper Limb during and after
stimulation (EAP; N=77)
Baseline
Change
During
Stimulation
Change After
Stimulation
N
mean ± SD
mean ± SD
mean ± SD
Forward Postural
Treatment 40
1.96 ± 0.54
-0.56 ± 0.59
-0.75 ± 0.65
Sham
37
1.91 ± 0.54
-0.35 ± 0.41
-0.35 ± 0.51
Lateral Postural
Treatment 40
2.29 ± 0.70
-0.51 ± 0.70
-0.56 ± 0.72
Sham
37
2.16 ± 0.57
-0.34 ± 0.44
-0.36 ± 0.54
Kinetic
Treatment 40
2.29 ± 0.47
-0.50 ± 0.51
-0.53 ± 0.59
Sham
37
2.27 ± 0.47
-0.31 ± 0.38
-0.34 ± 0.43
Upper Limb Total
Treatment 40
6.54 ± 1.34
-1.58 ± 1.46
-1.84 ± 1.64
Sham
37
6.34 ± 1.28
-1.00 ± 0.92
-1.05 ± 1.14
Additional Effectiveness Analyses
»
Change in TETRAS Upper Limb Tremor Tasks
Both the treatment and sham groups improved across
all 3 tasks during and after stimulation. The treatment
group improvement was greater than the sham group
both during and after stimulation and there was a
difference between the treatment and sham groups
for the upper limb total during and after stimulation
(an average improvement of 1.58 vs 1.00, and 1.84 vs
1.05 respectively.
V
er
y m
uc
h
imp
ro
ve
d
M
uc
h
imp
ro
ve
d
M
inim
al
ly
imp
ro
ve
d
N
o c
ha
ng
e
M
inim
al
ly
wo
rs
e
M
uc
h
wo
rs
e
V
er
y m
uc
h
wo
rs
e
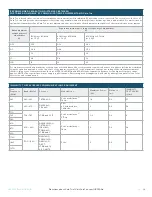
TABLE 7
Descriptive statistics of TETRAS Spiral ratings before and
during stimulation (EAP; N = 77)
Baseline
During
N
mean ± SD
Range
mean ± SD
Range
Treatment
40
2.95 ± 0.68
2.00 -
4.00
2.58 ± 0.90
1.17 -
4.00
Sham
37
2.63 ± 0.52
2.00 -
4.00
2.26 ± 0.67
0.67 -
4.00
»
Change in Activities of Daily Living
The treatment group improved compared to baseline
on all 7 activities. The sham group improved compared
to baseline for 5 of the 7 activities
(use a spoon to drink
soup, hold a cup of tea, pour milk from a bottle or carton,
dial a telephone, and insert an electric plug into a socket)
.
There was aggregate improvement across all 7 activities
(a total improvement of 4.65 (treatment) vs 2.51 (sham).)


