Save data:
Press SAVE button to save txt.file.
View Data Table
:
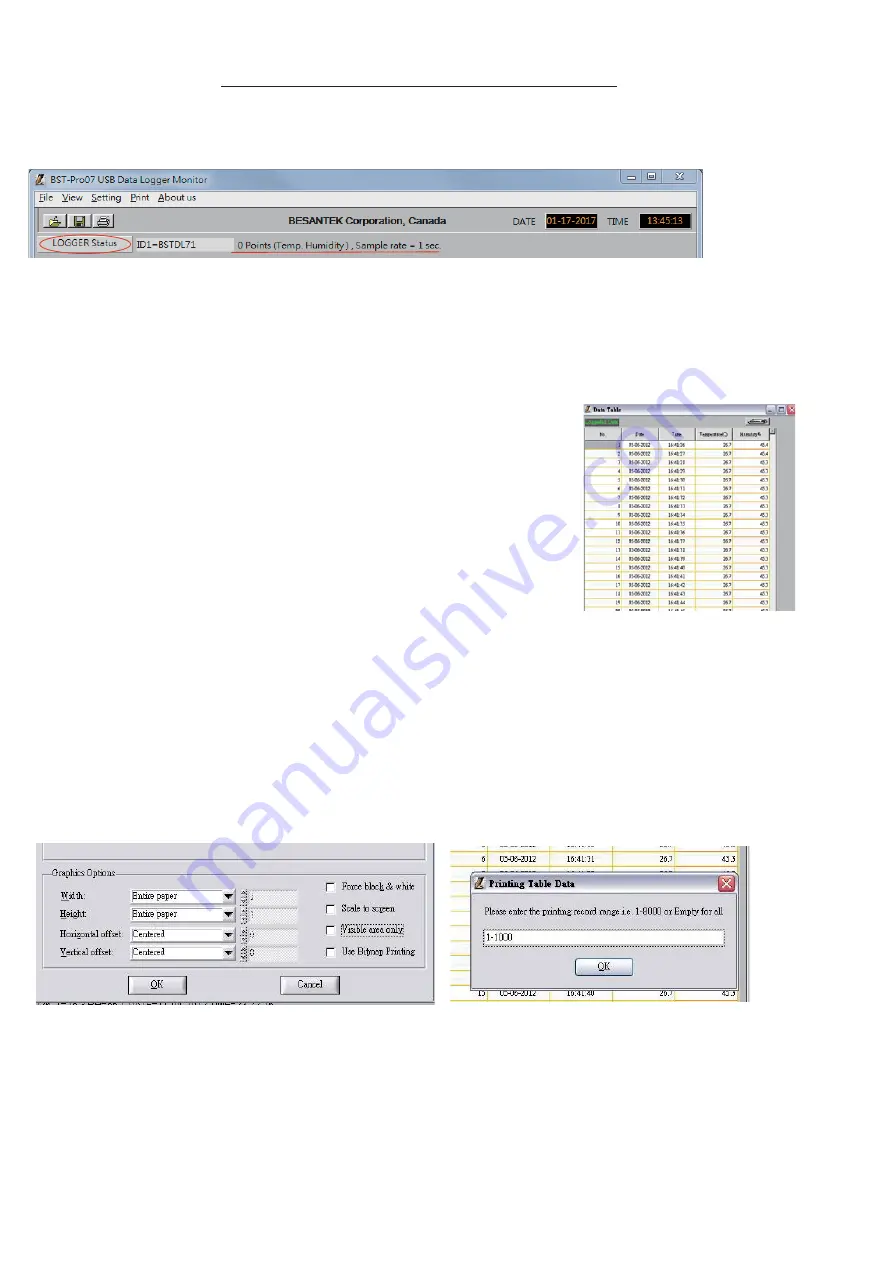
Press View button to get data table with details.(pic.6)
(pic.6)
Print graph:
Press PRINT button and print graph. Follow the print setting below to print full
screen graph. Press OK to print pdf file.(pic.7)
Print Table Data:
Press table data, the screen shows the record range, enter the start number
to the end number (For example: 1~500 or 200~1000...or leave it blank for
printing all data ).(pic.8)
Save each pdf. files with different names.
(pic.7)
√
√
(pic.8)
P6
Retrieve file:
Press OPEN FILE button to select file and show
the graph.
Logger Status:
Before download data, press
to show ID, Records, Sample rate,
LOGGER status
Unit. NOTE: Once
button is pressed, recording is inactivated.
Download
Download data:
Press DOWNLOAD button, data download in few seconds. Graph shows
automatically
Please do not press DOWNLOAD button if you won’t stop record.
NOTE:
You can press LOGGER STATUS button to see record points.
Data Clear
The data is stored in the memory till next setting start, meter will clean previous data
automatically. So if you start next data logging, there is no way you can find the data you haven't
stored.
INTERFACE INTRODUCTION


