10
s
The microphones used are not operated in accordance with their directivity (e.g. cardioid/super-cardioid).
s
The acoustic properties of the room are unfavorable. Tiled walls and floors heavily reflect the sound.
All rooms feature a number of natural resonances sometimes with “high” quality factor. At such frequencies
the potential risk of feedback is increased. In addition to the acoustic properties of the room, the relative
position of the microphone with reference to the loudspeaker plays a decisive role for the generation of
feedback. In practice, this phenomenon can be observed with microphone held directly in front of a speaker,
thus producing feedback. Of course, the first thing to do in such a case is to move the microphone away from
the speaker. When doing so, you can hear the feedback frequency change, because a variation in the
distance between microphone and loudspeaker results in a variation of feedback frequencies. It is therefore
very difficult to anticipate feedback frequencies and avoid their occurrence by means of equalizers with fixed
settings.
1.1.2 Graphic equalizers
Graphic equalizers are part of the audio engineer’s standard equipment for live applications. In this context,
graphic EQ’s usually perform two main tasks:
s
Fine tuning the mix to the room acoustics by inserting the EQ in the master inserts of the mixing console.
s
To some extent, experienced audio engineers can use graphic EQ’s to manually suppress annoying
feedback.
The 1/3-octave design with 31 faders per channel has become the standard among graphic equalizers. Here,
the spacing between individual filter frequencies is 1/3 octave. The quality factor (Q) of the filters (usually 1
octave) is fixed as are the frequencies controlled with the 31 faders.
1/3-octave equalizers are very popular (e.g. our ULTRA-CURVE DSP8000) because they are so easy to
operate. The fader positions clearly show how the signal is being processed, especially since graphic EQ’s
have fixed frequencies based on the so-call ISO standard. So, all graphic equalizers designed to meet the
ISO standard feature the same fixed frequencies. Once you’ve got used to work with a 1/3-octave equalizer,
you will find the FEEDBACK DESTROYER a highly convenient tool, as it splits up the audio spectrum into the
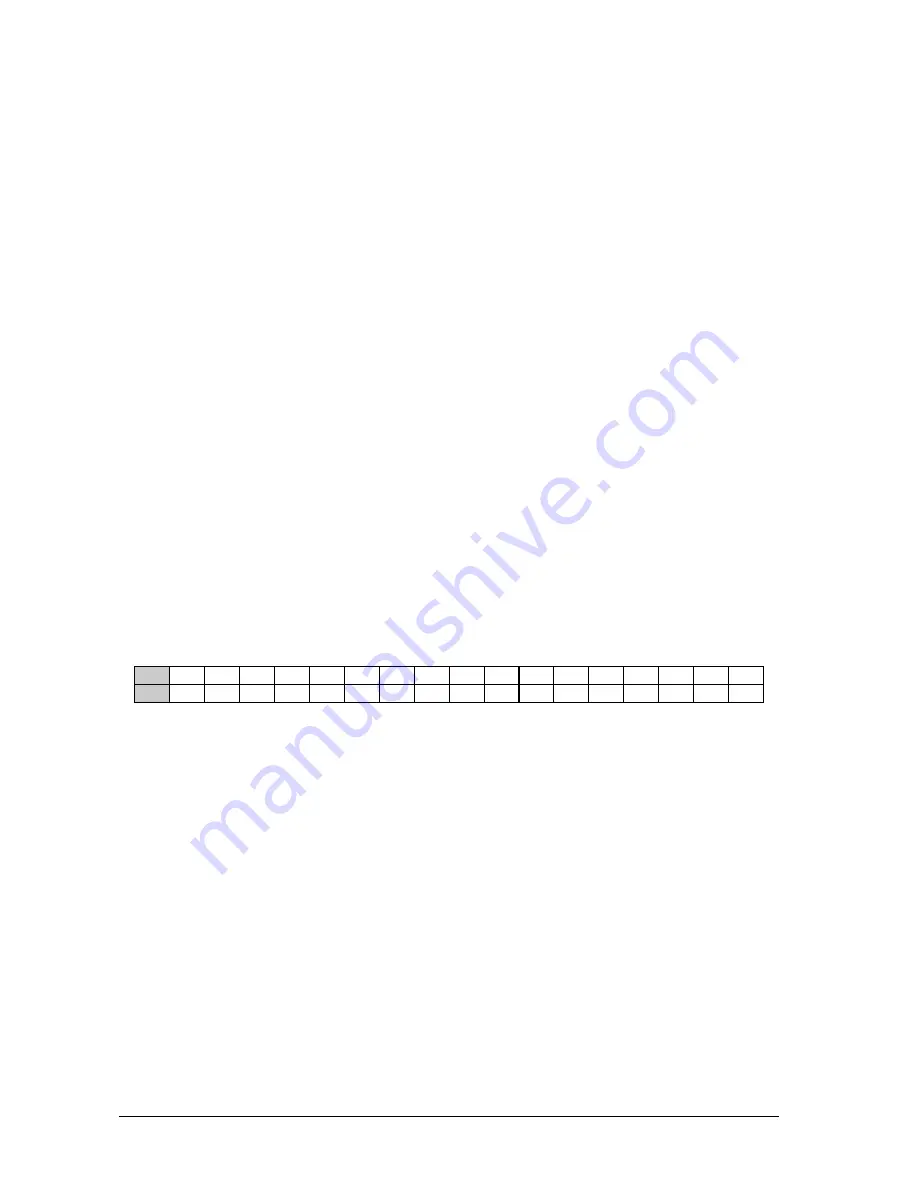
ISO frequencies (see table 1.2), which enables you to access the most important frequencies quickly. Of
course, you can use the Fine button to fine tune the standard ISO frequencies (in1/60-octave steps) within a
range of 1/3 octave.
Hz
20
25
31.5
40
50
63
80
100 125 160 200 250 315 400 500 630 800
kHz
1
1.25 1.6
2
2.5 3.15
4
5
6.3
8
10
12.5
16
20
Table 1.2: standard ISO frequencies
1.1.3 Parametric equalizers
Parametric equalizers, unlike graphic EQ’s, allow for selecting both the processing frequency and the band-
width, so that it is possible to process any given signal in full detail. Naturally, this equalizer design can also
be used to “filter” unwanted signals, however, only if these signal have a fixed frequency. If the frequency
changes, the parametric equalizer would have to be readjusted all the time. The majority of (analog) para-
metric EQ’s suffers from a quite fundamental drawback: they are operated by means of rotary controls, i.e.
contrary to graphic EQ’s, it is much more difficult to make necessary readjustments quickly.
1.2 The FEEDBACK DESTROYER
As you have seen, suppressing feedback with a graphic and/or parametric equalizer often means that you
have to accept compromises. Since feedback signals fail to comply with the standard ISO frequencies of
graphic EQ’s and additionally can have changing frequencies, their suppression with a graphic equalizer is
more or less a matter of luck.
Example: let’s assume a feedback signal at 1.8 kHz is produced during a concert. To suppress it, you’ve got
to cut the 1.8 kHz band on your EQ. However, since graphic equalizers only have 1.6 and 2 kHz bands, you
might need to attenuate both bands. Result: although feedback will be eliminated due to the low filter quality,
1. INTRODUCTION


