


14
Atwell International Limited
The rig is initiated by the release of an electromagnet under the smallest mass
which represents the “empty lift car”. The masses will then accelerate with a
“natural” value expressed by the equation:-
Acceleration = gn(mass1-mass2)/( mass2+mass3).................1
Where gn = gravitational constant = 9.81 m/sec2
mass1 = heaviest mass (either full car or counterweight with empty car)
mass2 = lightest mass
mass3 = equivalent mass of diverter pulleys, traction pulley, ropes etc
NB The highest acceleration on any lift system will occur with an empty
car and is the reason why the rig has been prepared in this format.
Based on the above equation, the “counterweight mass” will descend
at around 1.8 m/sec2.
The rig is fitted with a VG rope brake in an “inverted” configuration as this is
considered to be the worst case. The rope brake has been configured using the
application programme which forms part of its CE documentation. The brake can
be made inoperative if testing of the safety gear and governor is required.
The rig has a VG-4 safety gear mounted on top of the heaviest mass which
represents the “counterweight”. This is actuated by the OSG positioned between
the two masses. When testing the VG rope brake, the governor drop weight is
prevented from fully releasing.
The dynamic profile of the test rig has been appended to the VG rope brake
application programme. A printout of the programme is appended for reference
purposes. This amended programme will be used for all future applications using
the overspeed governor.
The individually measured response times, as required by section F.8.3, are used
to calculate the theoretical dynamic profile of the rig and then compared with
the actual recorded values. This will enable the effect of any changes in the
individual response times to be assessed accurately.
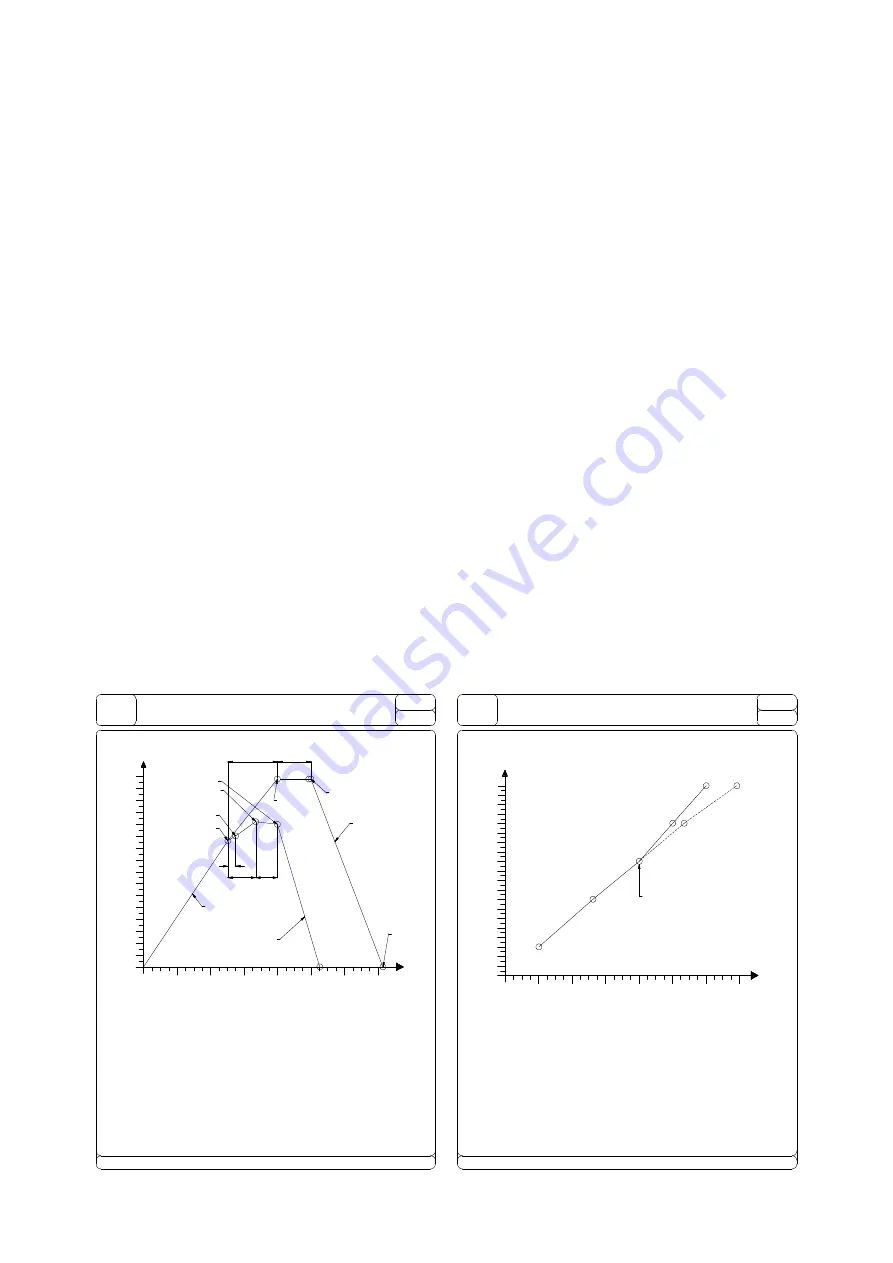
RIG Operation
Figure 3


