


© 2016 Araknis Networks
®
72
Araknis Networks Wireless Access Point
Product Manual
Advanced Menu
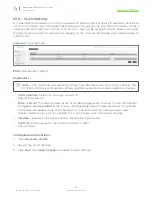
Real-time View
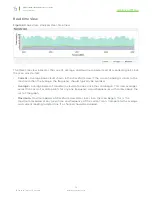
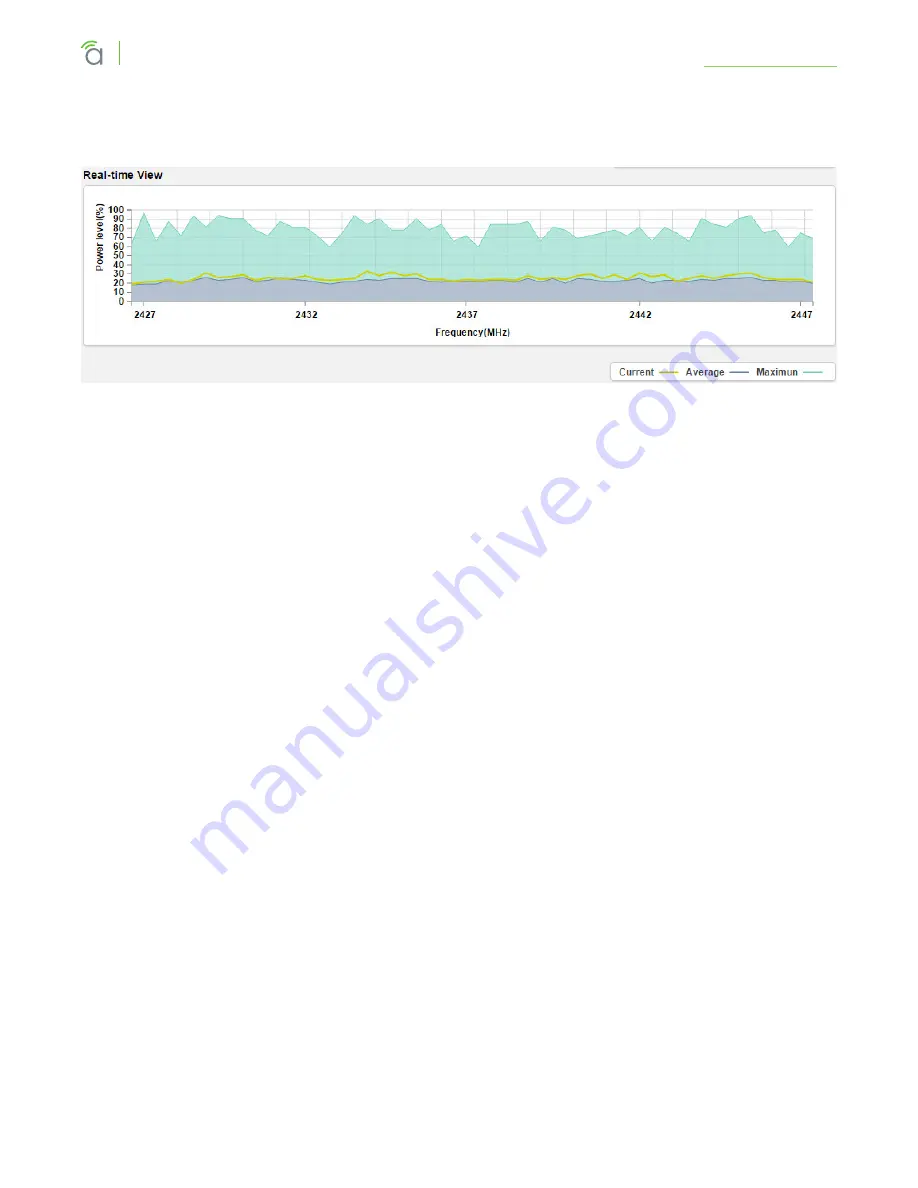
Figure 63.
Spectrum Analyzer Real-time View
The Real-time view indicates the current, average, and maximum power level of scanned signals since
the scan was started:
•
Current –
Average power level shown in the Waveform view. If the current reading is closer to the
maximum than the average, the frequency should typically be avoided.
•
Average –
Average power of Waveform view data since since the scan began. This view averages
across time as well as data points for any one frequency. Avoid frequencies with spikes above the
rest of the graph.
•
Maximum–
Maximum power of Waveform view data since since the scan began. This is the
maximum recorded at any given time and frequency of the current scan. Compare to the average
and current reading to determine if a channel should be avoided.


