12
Spectral Errors for PPFD and YPFD Measurements with Apogee MQ Series Quantum Meters
Radiation Source (Error Calculated Relative to Sun, Clear Sky)
PPFD Error [%]
YPFD Error [%]
Sun (Clear Sky)
0.0
0.0
Sun (Cloudy Sky)
1.4
1.6
Reflected from Grass Canopy
5.7
-6.3
Reflected from Deciduous Canopy
4.9
-7.0
Reflected from Conifer Canopy
5.5
-6.8
Transmitted below Grass Canopy
6.4
-4.5
Transmitted below Deciduous Canopy
6.8
-5.4
Transmitted below Conifer Canopy
5.3
2.6
Radiation Source (Error Calculated Relative to Cool White Fluorescent, T5)
Cool White Fluorescent (T5)
0.0
0.0
Cool White Fluorescent (T8)
-0.3
-1.2
Cool White Fluorescent (T12)
-1.4
-2.0
Compact Fluorescent
-0.5
-5.3
Metal Halide
-3.7
-3.7
Ceramic Metal Halide
-6.0
-6.4
High Pressure Sodium
0.8
-7.2
Blue LED (448 nm peak, 20 nm full-width half-maximum)
-12.7
8.0
Green LED (524 nm peak, 30 nm full-width half-maximum)
8.0
26.2
Red LED (635 nm peak, 20 nm full-width half-maximum)
4.8
-6.2
Red, Blue LED Mixture (85 % Red, 15 % Blue)
2.4
-4.4
Red, Green, Blue LED Mixture (72 % Red, 16 % Green, 12 % Blue)
3.4
0.2
Cool White Fluorescent LED
-4.6
-0.6
Neutral White Fluorescent LED
-6.7
-5.2
Warm White Fluorescent LED
-10.9
-13.0
Quantum sensors can be a very practical means of measuring PPFD and YPFD from multiple radiation sources, but spectral
errors must be considered. The spectral errors in the table above can be used as correction factors for individual radiation
sources.
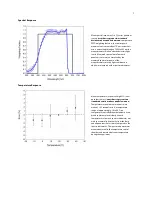
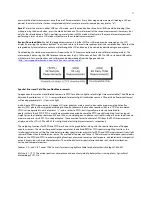
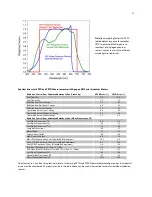
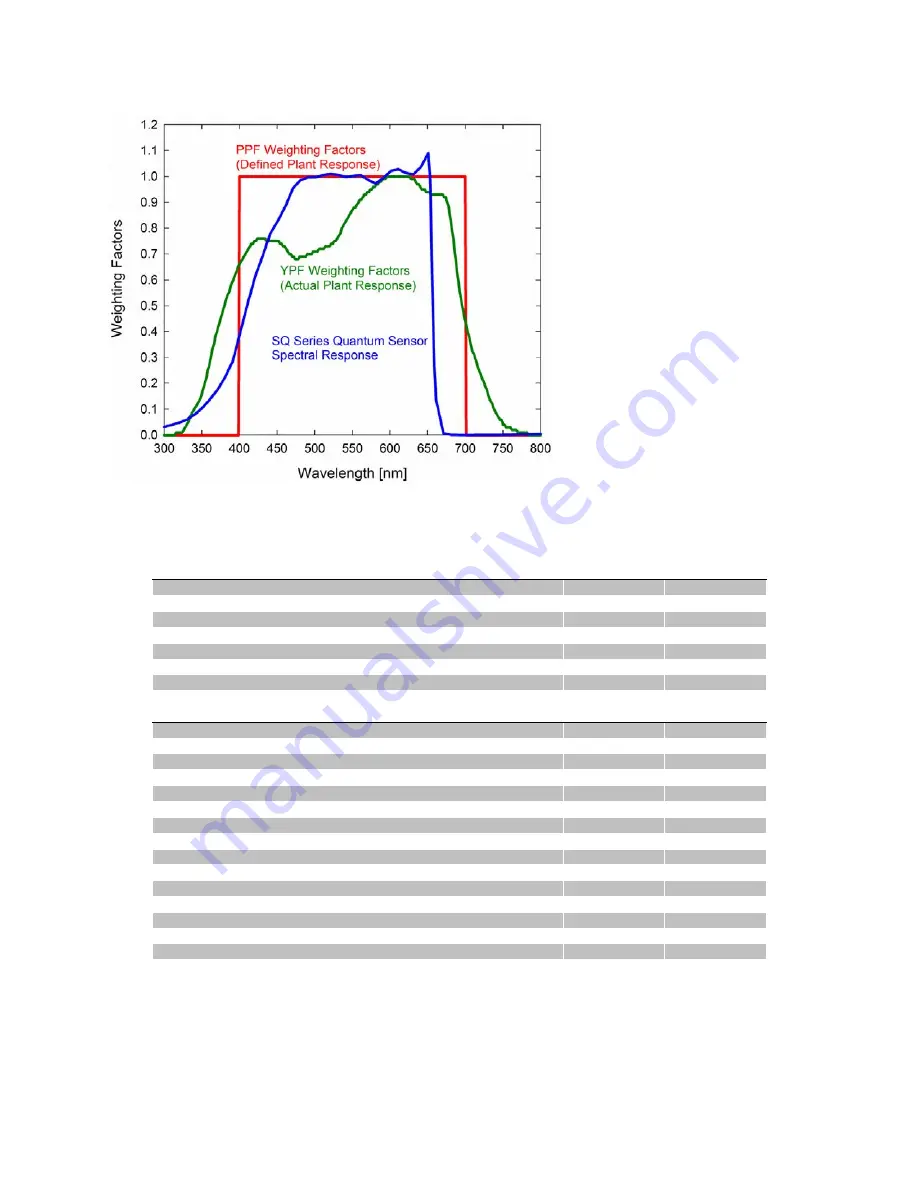
Radiation weighting factors for PPFD
(defined plant response to radiation),
YPFD (measured plant response to
radiation), and Apogee quantum
sensors (sensor sensitivity to different
wavelengths of radiation).


