Wanguard 6.2 User Guide
Reports » Components
Servers
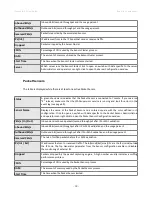
The table displays the following data for each server that runs software components of Wanguard:
Status
A green check mark indicates that the server is connected to Console. When a red “X” is
displayed, start the WANsupervisor service and make sure that the clocks are synchronized
between the server and the Console server.
Server Name
Displays the name of the server and a colored square with the color defined in its
configuration. Click to open a new tab with data specific to the server. Administrators and
operators can right-click to open the Server Configuration window.
Load
Load average reported by the Linux kernel for the last 5 minutes.
Free RAM
Available RAM. Swap memory is not counted.
CPU% User
Percentage of CPU resources used by the user space processes. Can be >100% on multiple
cores/CPUs (e.g. the maximum value for a quad-core system is 400%).
CPU% System
Percentage of CPU resources used by the kernel. Can be >100% on multiple cores/CPUs (e.g.
the maximum value for a quad-core system is 400%).
CPU% IOwait
Percentage of CPU resources waiting for I/O operations. A high number indicates an I/O
bottleneck.
CPU% Idle
Percentage of idle CPU resources. Can be >100% on multiple cores/CPUs (e.g. the maximum
value for a quad-core system is 400%).
Free Flows Disk
Disk space available on the partition that is configured to store flows.
Free Dumps Disk
Disk space available on the partition that is configured to store packet dumps.
Contexts/IRQs/SoftIRQs
Context switches, hardware interrupts and software interrupts per second.
Uptime
Uptime of the operating system.
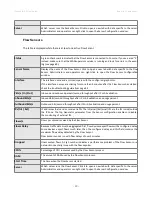
Sensor Clusters
The table is displayed while there is at least one active Sensor Cluster.
Status
A green check mark indicates that the Sensor Cluster is connected to Console. If you see a red
“X” instead, make sure that the WANsupervisor service is running and look for errors in the
event log (see page 69).
Sensor Name
Displays the name of the Sensor Cluster and a colored square with the color defined in its
configuration. Click to open a new tab with data specific to the Sensor Cluster. Administrators
and operators can right-click to open the Sensor Cluster configuration window.
Pkts/s (In / Out)
Inbound and outbound packets/second throughput.
- 87 -
Содержание wanguard 6.2
Страница 1: ......


