page you can access the Alarms, Performance, Queries, and Loads tabs which contain the
performance data. These tabs are shown in the following example.
Viewing Cluster Performance Data
Cluster metrics in Amazon Redshift enable the following common performance use cases:
• Determine if cluster metrics are abnormal over a specified time range and, if so, identify the queries
responsible for the performance hit.
• Check if historical or current queries are impacting cluster performance. If you identify a problematic
query, you can be view details about it including the cluster performance during the query's execution,
information which may assist you in diagnosing why the query was slow, and what can be done to
improve its performance.
The default cluster view shows all nodes graphed together, an
Average
statistic, and data for the last
hour. You can change this view as needed. Some metrics, such as
HealthStatus
, are only applicable
for the leader node while others, such as
WriteOps
, are only applicable for compute nodes. Switching
the node display mode will reset all filters.
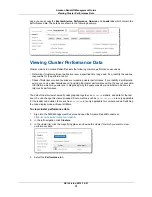
To view cluster performance data
1.
Sign into the AWS Management Console and open the Amazon Redshift console at
https://console.aws.amazon.com/redshift
.
2.
In the left navigation, click Clusters.
3.
In the cluster list, click the magnifying glass icon beside the cluster for which you want to view
performance data.
4.
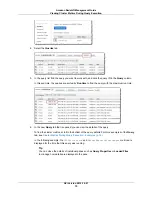
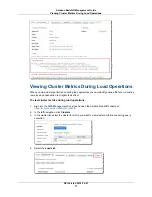
Select the Performance tab.
API Version 2012-12-01
72
Amazon Redshift Management Guide
Viewing Cluster Performance Data


