


6 - Getting Started
Graph
30
SMU4000 Series Instruction Manual
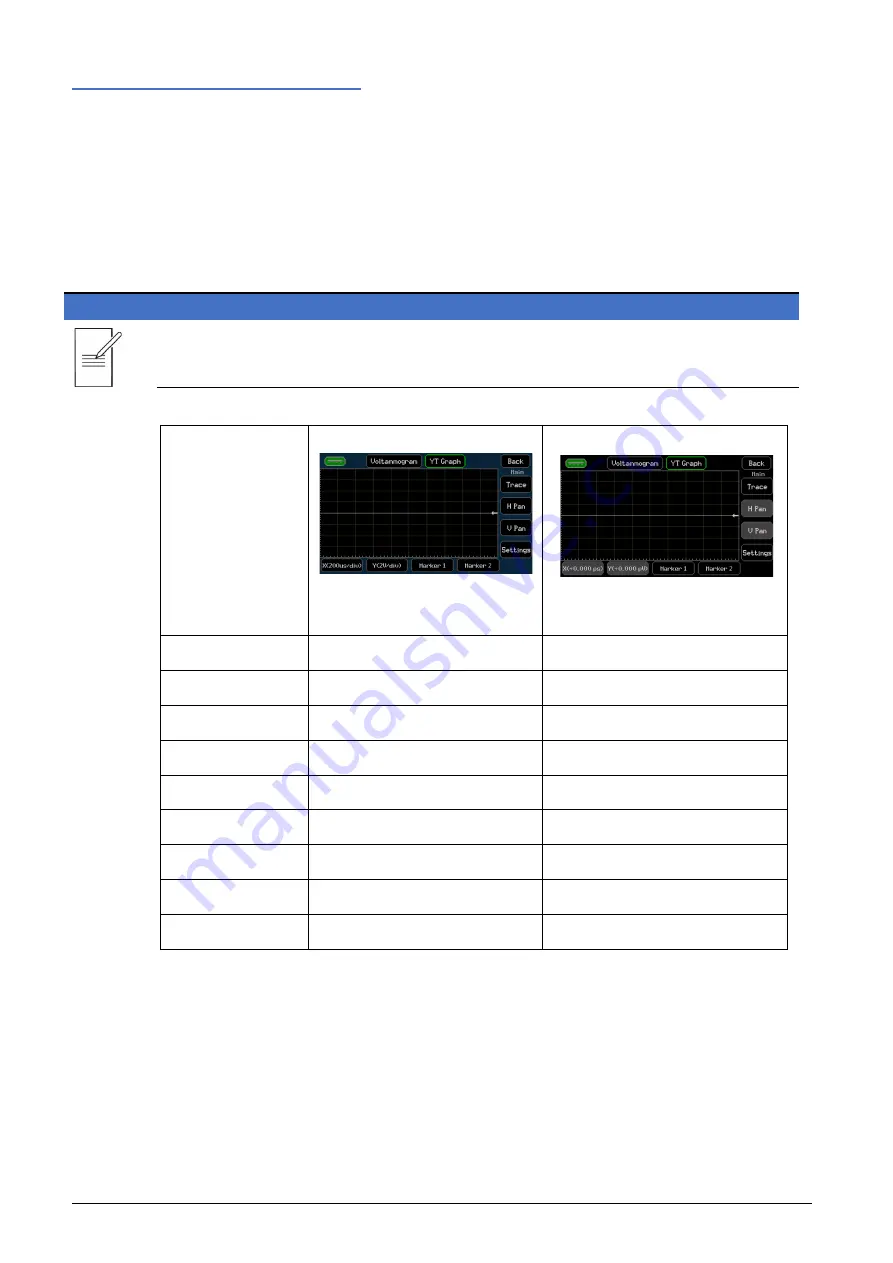
Graph
The Graph provides a graphical representation of the buffered results. This may be real time
data or previous test data already stored in the buffer. The real time / buffered data is always
shown in yellow. Any saved ‘Trace’ data is shown in blue- see ‘
for more details.
There are two separate graphing menus; graphing options with full manual control that is
accessed from the Configuration (CNFG) menu, and a view of the graph that is accessed from
the home screen.
NOTE
The two graph menus are linked; changes made in the
Graph
menu will be reflected in
Graph
view
and vice-versa.
Feature
Graph
(Blue background)
CNFG > [Files] Graph
Graph View
(Black Background)
HOME > Graph View
Auto-Scale
•
Auto-Fit
•
Graph Type
•
•
Graph Style
•
•
Minimum Position
•
•
Markers
•
•
Save/Load Trace
•
•
Panning
•
Zooming
•